Redevelopment Economics at Superfund Sites
You may need a PDF reader to view some of the files on this page. See EPA’s About PDF page to learn more.
On this page:
- Basic Information
- National Beneficial Effects
- Regional Economic Profiles
- Beneficial Effects Economic Case Studies
- Information about Site-Specific Economic Highlights
Basic Information
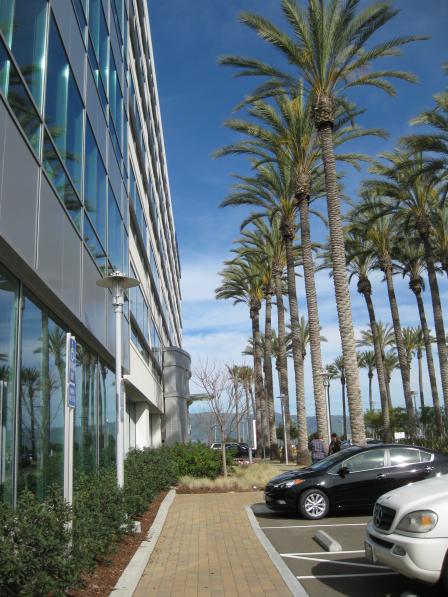 Businesses at the South Bay Asbestos Area site in California employ over 1,800 people and generate over $825 million in annual sales; site properties generate nearly $5 million in property tax revenues [2018].
For over three decades, EPA’s Superfund program and its partners have remediated contaminated hazardous waste sites and furthered community goals for reuse. Communities reuse Superfund sites in many ways – parks, shopping centers, athletic fields, wildlife sanctuaries, manufacturing facilities, residences, roads and more.
Many reuse outcomes can play a role in economically revitalizing a community. EPA measures the economic beneficial effects of reuse at Superfund sites by collecting the following types of information:
- Number of businesses located on site.
- Number of people employed at site businesses.
- Annual employment income from on-site jobs.
- Annual sales revenue generated by businesses on site.
- On-site property value and property tax information.
- Other economic impacts that are unique to specific sites.
SRI tracks these figures from year to year, to give a general overview of the national beneficial effects associated with Superfund redevelopment:
SRI compiles Regional Economic Profiles to track the economic effects and benefits to the community at a region-wide scale.
SRI writes Beneficial Effects Economic Case Studies that allow for a site-specific approach to gathering more complete information related to reuse, employment and other economic impacts.
EPA has created a brochure that highlights the Beneficial Effects of Site Reuse:
EPA has created a Superfund Redevelopment Economics Notebook that discusses various reuse economic tools:
- Superfund Redevelopment Economics Notebook (PDF)(10 pp, 811 K)
National Beneficial Effects
Innovative business owners and organizations reuse Superfund sites for a variety of purposes. Some uses can play a role in economically revitalizing a community. EPA has estimated the national economic beneficial effects of Superfund sites in reuse between 2011 and 2019. In 2019, 602 Superfund sites had available economic data, representing only a percentage of all sites in reuse and excludes sites at federal facilities. The remaining non-federal facility sites in reuse and continued use are not expected to have uses that support on-site businesses, provide jobs or generate sales revenue.
National economic totals increased across all categories between 2018 and 2019, primarily due to the collection of economic information at several sites with newly identified reuses. However, other independent economic factors, such as business conditions, impacted the 2019 national economic totals as well.
Factors that contribute to changes in economic values from year to year include:
- Increases in the number of sites in reuse.
- Changes in the number of on-site businesses.
- Additional efforts to collect more information on more sites, including large and complex sites.
- Changes in the availability of data through online sources.
- Independent economic factors.
| Estimates of National Beneficial Effects Since 2011 | |||||
|---|---|---|---|---|---|
| Year | Sites in Reuse with Economic Data |
|
Annual Sales* |
Jobs | Annual Employment Income* |
| 2011 | 135 | 271 | $10.0 billion | 24,308 | $1.8 billion |
| 2012 | 276 | 972 | $22.2 billion | 46,475 | $3.7 billion |
| 2013 | 363 | 2,216 | $35.8 billion | 70,270 | $5.4 billion |
| 2014 | 450 | 3,474 | $34.0 billion | 89,646 | $6.5 billion |
| 2015 | 454 | 3,908 | $31.3 billion | 108,445 | $8.4 billion |
| 2016 | 458 | 4,720 | $36.2 billion | 131,635 | $9.8 billion |
| 2017 | 487 | 6,622 | $45.5 billion | 156,352 | $11.7 billion |
| 2018 | 529 | 8,690 | $53.4 billion | 195,465 | $13.6 billion |
| 2019 | 602 | 9,188 | $58.3 billion | 208,468 | $14.4 billion |
| *Adjusted to 2019 USD using the Consumer Price Index (CUUR0000SA0, not seasonally adjusted, U.S. city annual average). | |||||
Readily available internet and database sources are utilized to create estimates of national totals related to the beneficial effects of Superfund sites in reuse. Without more extensive research it is not always possible to identify all business names and addresses on site.
Jobs are not the only way communities benefit when Superfund sites are cleaned up. A 2009 report provides an overview of how cleaning up sites may benefit home prices:
- Challenges in Applying Property Value Studies to Assess the Benefits of the Superfund Program (PDF)(35 pp, 427 K)
Regional Economic Profiles
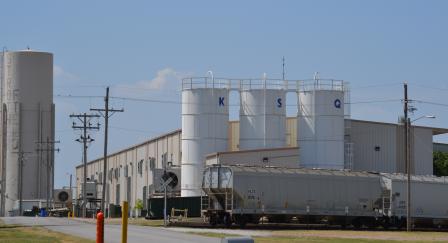 Businesses at the Strother Field Industrial Park site in Kansas employ over 1,300 people and generate over $128 million in annual sales; site properties generate over $350,000 in property tax revenues [2018].
SRI has developed regional economic profiles that tell a story about the role of Superfund in each EPA region and the beneficial effects of reusing formerly contaminated properties. These reports summarize economic data collected for Superfund sites within an EPA region. They also highlight successes and put them in the context of aggregated data within the state and EPA region.
- Region 1 (2020) (PDF) (84 pp, 22.5 MB)
- Region 2 (2020) (PDF) (32 pp, 10.1 MB)
- Region 3 (2020) (PDF) (32 pp, 11.8 MB)
- Region 4 (2020) (PDF) (36 pp, 13.6 MB)
- Region 5 (2020) (PDF)(36 pp, 12.4 MB)
- Region 6 (2020) (PDF) (36 pp, 11.8 MB)
- Region 7 (2020) (PDF) (32 pp, 8.4 MB)
- Region 8 (2020) (PDF) (36 pp, 9.9 MB)
- Region 9 (2020) (PDF) (32 pp, 14.5 MB)
- Region 10 (2020) (PDF)(32 pp, 12.2 MB)
Beneficial Effects Economic Case Studies
A beneficial effects economic case study gathers more complete information related to reuse, employment and other beneficial effects. While national impact estimates may underestimate jobs, a local beneficial effects case study can obtain detailed information about economic benefits for every company present on the site, in addition to unique economic benefits provided by particular uses, such as alternative energy.
Each beneficial effects economic case study includes a technical appendix that provides an overview of the approaches, assumptions and methodologies used to obtain estimates on local beneficial effects.
Additional case studies can be found on the Superfund Redevelopment Case Studies page:
| Site Name | State | Region | Year |
|---|---|---|---|
| Abex Corporation (PDF)(8 pp, 267 K) | Virginia | 3 | 2011 |
| Aidex Corporation (PDF)(7 pp, 899 K) | Iowa | 7 | 2015 |
| Airco Plating Company (PDF)(9 pp, 1 MB) | Florida | 4 | 2016 |
| American Cyanamid Co. (PDF)(15 pp, 3.2 MB) | New Jersey | 2 | 2018 |
| Big River Mine Tailings/St. Joe Mineral Corp. (PDF) (429 pp, 12 MB) | Missouri | 7 | 2018 |
| Benfield Industries (PDF) (7 pp, 365 K) | North Carolina | 4 | 2012 |
| Blackburn & Union Privileges (PDF)(8 pp, 2.1 MB) | Massachusetts | 1 | 2019 |
| BMI-Textron and Trans Circuits, Inc. (PDF) (10 pp, 509 K) | Florida | 4 | 2014 |
| Boise Cascade/Onan Corp./Medtronics, Inc. (PDF) | Minnesota | 5 | 2017 |
| Brunswick Naval Air Station (PDF)(28 pp, 3.7 MB) | Maine | 1 | 2019 |
| Bunker Hill Mining and Metallurgical Complex (PDF)(172 pp, 8.9 MB) | Idaho | 10 | 2017 |
| Calhoun Park Area (PDF)(17 pp, 1.8 MB) | South Carolina | 4 | 2014 |
| California Gulch (PDF) (13 pp, 1.1 MB) | Colorado | 8 | 2014 |
| Cherokee County (PDF)(234 pp, 9.1 MB) | Kansas | 7 | 2020 |
| Coalinga Asbestos Mine (PDF)(21 pp, 1.3 MB) | California | 9 | 2015 |
| Colorado Smelter (PDF)(46 pp, 3.8 MB) | Colorado | 8 | 2020 |
| Davie Landfill (PDF) (57 pp, 1.2 MB) | Florida | 4 | 2014 |
| Davisville Naval Construction Battalion Center (PDF)(31 pp, 4.4 MB) | Rhode Island | 1 | 2018 |
| Del Amo (PDF)(44pp, 1.5 MB) | California | 9 | 2013 |
| Denver Radium (PDF)(21 pp, 4.3 MB) | Colorado | 8 | 2019 |
| Eastland Woolen Mill (PDF)(8 pp, 2 MB) | Maine | 1 | 2019 |
| Ecosystem Services at Superfund Sites (PDF)(27 pp, 2.2 MB) | Multiple | Multiple | 2017 |
| E.I. du Pont de Nemours & Co., Inc. (Newport Pigment Plant Landfill) (PDF)(9 pp, 708 K) | Delaware | 3 | 2014 |
| Flat Creek IMM (PDF)(30 pp, 2.8 MB) | Montana | 8 | 2019 |
| FMC Corp. (Yakima Pit) (PDF) (7 pp, 772 K) | Washington | 10 | 2014 |
| Fort Devens (PDF) (27 pp, 1.64 MB) | Massachusetts | 1 | 2018 |
| General Electric Co./Shepherd Farm (PDF) (10 pp, 1 MB) | North Carolina | 4 | 2017 |
| General Mills/Henkel Corp. (PDF) (11 pp, 877 K) | Minnesota | 5 | 2014 |
| Goldisc Recordings, Inc. (PDF)(10 pp, 1.9 MB) | New York | 2 | 2015 |
| Havertown PCP (PDF)(11 pp, 2.1 MB) | Pennsylvania | 3 | 2017 |
| Highway 71/72 Refinery (PDF)(14 pp, 2.3 MB) | Louisiana | 6 | 2015 |
| Industri-Plex (PDF) (21 pp, 1.6 MB) | Massachusetts | 1 | 2014 |
| Iron Horse Park (PDF)(9 pp, 2 MB) | Massachusetts | 1 | 2017 |
| Joslyn Manufacturing & Supply Co. (PDF)(12 pp, 670 K) | Minnesota | 5 | 2016 |
| Kansas City Structural Steel (PDF)(9 pp, 2 MB) | Kansas | 7 | 2015 |
| Kearsarge Metallurgical Corp. (PDF)(9 pp, 2 MB) | New Hampshire | 1 | 2016 |
| Kennecott (South Zone) (PDF) | Utah | 8 | 2017 |
| Koppers Coke (PDF) (10 pp, 612 K) | Minnesota | 5 | 2012 |
| Lexington County Landfill (PDF) (8 pp, 784 K) | South Carolina | 4 | 2014 |
| Liberty Industrial Finishing (PDF) (8 pp, 833 K) | New York | 2 | 2014 |
| Lindsay Manufacturing Co. (PDF)(7 pp, 860 K) | Nebraska | 7 | 2017 |
| Lipari Landfill (PDF)(19 pp, 5.3 MB) | New Jersey | 2 | 2020 |
| Loring Air Force Base (PDF)(18 pp, 5.7 MB) | Maine | 1 | 2018 |
| Macalloy Corporation (PDF) (9 pp, 389 K) | South Carolina | 4 | 2012 |
| Martin-Marietta, Sodyeco, Inc. (PDF)(10 pp, 1.5 MB) | North Carolina | 4 | 2018 |
| Materials Technology Laboratory (US Army) (PDF) (11 pp, 1.8 MB) | Massachusetts | 1 | 2018 |
| Midvale Slag (PDF)(38 pp, 3.1 MB) | Utah | 8 | 2015 |
| Murray Smelter (PDF) (10 pp, 1.0 MB) | Utah | 8 | 2012 |
| Naval Industrial Reserve Ordnance Plant (PDF)(13 pp, 2.4 MB) | Minnesota | 5 | 2020 |
| North Penn Area 12 (PDF) (6 pp, 448 K) | Pennsylvania | 3 | 2014 |
| North Ridge Estates (PDF) (13 pp, 2.2 MB) | Oregon | 10 | 2018 |
| Northwest Pipe & Casing/Hall Process Company (PDF)(10 pp, 1.1 MB) | Oregon | 10 | 2015 |
| Onondaga Lake (PDF) (12 pp, 2 MB) | New York | 2 | 2018 |
| Operating Industries, Inc. Landfill (PDF)(10 pp, 1.9 MB) | California | 9 | 2020 |
| Pacific Sound Resources (PDF) (12 pp, 1.3 MB) | Washington | 10 | 2013 |
| Pease Air Force Base (PDF) (37 pp, 2.2 MB) | New Hampshire | 1 | 2018 |
| Peterson/Puritan, Inc. (PDF) (19 pp, 1.3 MB) | Rhode Island | 1 | 2014 |
| Phoenix-Goodyear Airport Area (PDF)(18 pp, 968 K) | Arizona | 9 | 2015 |
| PJP Landfill (PDF)(11 pp, 2.2 MB) | New Jersey | 2 | 2016 |
| PMC Groundwater (PDF) (13 pp, 1.2 MB) | Michigan | 5 | 2014 |
| Portland Cement (Kiln Dust 2 & 3) (PDF)(12 pp, 1.7 MB) | Utah | 8 | 2019 |
| Raymark Industries, Inc. (PDF)(9 pp, 1.3 MB) | Connecticut | 1 | 2016 |
| Recreational Redevelopment at Superfund Sites (PDF)(9 pp, 2.4 MB) | Multiple | Multiple | 2020 |
| Reynolds Metals Company (PDF)(10 pp, 1.9 MB) | Oregon | 10 | 2019 |
| Roebling Steel Company (PDF)(14 pp, 1.3 MB) | New Jersey | 2 | 2016 |
| RSR Corporation (PDF)(56 pp, 3.7 MB) | Texas | 6 | 2015 |
| San Fernando Valley (Area 1) (PDF)(30 pp, 5.8 MB) | California | 9 | 2018 |
| Sherwood Medical Co. (PDF)(8 pp, 1 MB) | Nebraska | 7 | 2015 |
| SMS Instruments, Inc. (PDF) (6 pp, 1.1 MB) | New York | 2 | 2014 |
| Sola Optical USA, Inc. (PDF)(7 pp, 727 K) | California | 9 | 2016 |
| Solitron Microwave (PDF) (7 pp, 607 K) | Florida | 4 | 2012 |
| South Andover (PDF) (11 pp, 398 K) | Minnesota | 5 | 2011 |
| South Bay Asbestos Area (PDF)(15 pp, 766 K) | California | 9 | 2015 |
| South Point Plant (PDF) (15 pp, 4.2 MB) | Ohio | 5 | 2020 |
| Southside Sanitary Landfill (PDF) (6 pp, 255 K) | Indiana | 5 | 2011 |
| State Marine of Port Arthur/Palmer Barge Line (PDF)(9 pp, 777 K) | Texas | 6 | 2017 |
| Strother Field Industrial Park (PDF)(12 pp, 1.4 MB) | Kansas | 7 | 2015 |
| Tucson International Airport Area (PDF)(27 pp, 1.6 MB) | Arizona | 9 | 2016 |
| Universal Oil Products (Chemical Division) (PDF) (11 pp, 1.2 MB) | New Jersey | 2 | 2013 |
| Vasquez Boulevard & I-70 (PDF)(147 pp, 4.3 MB) | Colorado | 8 | 2017 |
| Vertac, Inc. (PDF) (9 pp, 610 K) | Arkansas | 6 | 2012 |
| Waite Park Wells (PDF)(17 pp, 2 MB) | Minnesota | 5 | 2018 |
| Waste Disposal, Inc. (PDF) (13 pp, 752 K) | California | 9 | 2014 |
| Wells G&H (PDF) (40 pp, 2.3 MB) | Massachusetts | 1 | 2018 |
| Welsbach and General Gas Mantle (PDF)(10 pp, 1.8 MB) | New Jersey | 2 | 2015 |
| Whitmoyer Laboratories (PDF)(13 pp, 5.8 MB) | Pennsylvania | 3 | 2020 |
Information about Site-Specific Economic Highlights
The reuse of Superfund sites provides a wide range of benefits to local communities across the country. Some of these benefits are easy to quantify, while others are not. For example, commercial or industrial reuse of a site can bolster local economies by supporting jobs and generating sales revenues. However, not all sites in reuse involve an on-site business or other land use that would employ people. Therefore, economic information is not available for all sites in reuse. This could be attributed to several factors, including:
- There may be no revenue-generating businesses operating on site.
- There may be a business or businesses operating on site for which economic information is not available.
- In some cases, due to the large footprint of a site, it is not feasible to collect economic information for such a large area (i.e., an entire town). In these cases, a site snapshot may discuss widespread site reuse, but economic information may not be available for the site.
- Due to a time lag between when site snapshots are updated and when economic information is added to SURE, it is possible that economic research may not be performed to capture new reuse mentioned in a snapshot until after the snapshot has been updated.
Many sites without businesses have beneficial effects that are not easily quantified, such as properties providing ecological or recreational benefits (e.g., parks, wetlands, ecological habitat, open space). Also, not all sites in reuse are well-suited for revenue-generating reuse. If a site is not located in an area appropriate for commercial or industrial reuse, it may not be a realistic option to have it redeveloped into something that will support jobs. EPA’s Superfund Redevelopment Initiative quantifies many types of beneficial effects of reuse at Superfund sites including the number of on-site jobs, estimated annual employment income and sales revenue generated by on-site businesses.
EPA obtains economic data for sites in reuse from reputable sources. Information on the number of employees and sales volume for on-site businesses typically comes from the Hoovers/Dun & Bradstreet (D&BExit) database. When Hoovers/D&B database research is not able to identify employment and sales information for on-site businesses, EPA uses the MantaExit and ReferenceUSAExit databases. These databases include data reported by businesses. Accordingly, some reported values might be underestimates or overestimates. In some instances, business and employment information come from local newspaper stories/articles and discussions with local officials and business representatives. In general, economic information gathered for sites in reuse is conservative, based on available resources. In some cases, especially for exceptionally large sites, the economic information presented may not be comprehensive of the entire site, presenting a conservative estimate of the economic benefits of reuse at the given site.