Environmental Professional’s Guide to Lean and Six Sigma: Chapter 3
What is Six Sigma?
- Six Sigma Definition
- History of Six Sigma
- Method and Implementation Approach
- Six Sigma Statistical Tools
- Where to Find More Information on Six Sigma
- Toolkit Navigation
Six Sigma Definition
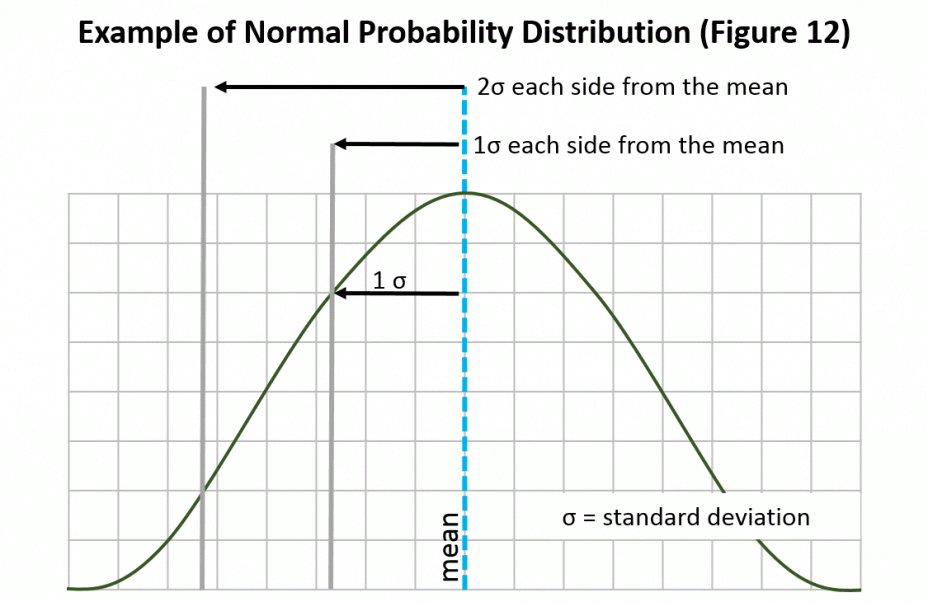
 Six Sigma refers to a set of well-established statistical quality control techniques and data analysis methods used to identify and reduce variation in products and processes. Sigma is a letter in the Greek alphabet that represents the standard deviation from a statistical population, so “six sigma” denotes a target level of quality that is six times the standard deviation. This means that defects only occur approximately 3.4 times per million opportunities, representing high quality and minimal
 ![]() process variability. Six Sigma methods are used to support and guide organizational continual improvement activities. By using Six Sigma statistical tools, companies are able to diagnose the root causes of performance gaps and variability, thereby improving productivity and product quality. Six Sigma borrows martial arts ranking terminology to define practitioner roles.
process variability. Six Sigma methods are used to support and guide organizational continual improvement activities. By using Six Sigma statistical tools, companies are able to diagnose the root causes of performance gaps and variability, thereby improving productivity and product quality. Six Sigma borrows martial arts ranking terminology to define practitioner roles.
History of Six Sigma
The use of Six Sigma as a tool for improving manufacturing processes and eliminating defects can be traced back to the 1920s; however, it was not widely used as a quality control technique until the late 1980s. Motorola engineers, interested in more closely measuring defects in products and eliminating them, developed the Six Sigma continual improvement philosophy and many of the statistical tools used to implement this philosophy. At that time, Motorola was under the direction of Chairman Bob Galvin. Since Motorola’s development of Six Sigma, the techniques have been widely adopted by companies in a variety of industrial sectors. General Electric’s CEO Jack Welch adopted Six Sigma’s techniques for his business strategy in 1995, which helped to expand the use of the Six Sigma philosophy even further.
Method and Implementation Approach
![]() Six Sigma typically involves implementing a five-step process called the DMAIC (Define, Measure, Analyze, Improve, and Control) process. This process is used to guide implementation of Six Sigma statistical tools and to identify process wastes and variation. It is similar to the Plan-Do-Check-Act business process improvement method.
Six Sigma typically involves implementing a five-step process called the DMAIC (Define, Measure, Analyze, Improve, and Control) process. This process is used to guide implementation of Six Sigma statistical tools and to identify process wastes and variation. It is similar to the Plan-Do-Check-Act business process improvement method.
The steps in the Six Sigma DMAIC process are as follows.
- Define: In this phase, Six Sigma teams focus on defining the problem statement - including project improvement activity goals and identifying the issues that need to be addressed to achieve a higher sigma level.
- Measure: In the Measure phase, the aim is to gather information about the targeted process. Metrics are established and used to obtain baseline data on process performance and to help identify problem areas.
- Analyze: This phase is concerned with identifying the root cause(s) of quality problems, and confirming those causes using appropriate statistical tools.
- Improve: During the Improve phase, teams work on implementing creative solutions to the problems identified. Sometimes Lean methods, such as cellular manufacturing, 5S, mistake-proofing, and total productive maintenance, are identified as potential solutions. Teams conduct statistical assessments of improvement in this stage as well.
- Control: In the final phase, teams work to institutionalize the improved system by modifying policies, procedures, and other management systems. Process performance results are again periodically monitored to ensure productivity improvements are sustained.
 Six Sigma projects are led by trained “green belt” and “black belt” practitioners. Green belts are employees who take up Six Sigma implementation along with their other job responsibilities. They lead less complex projects and operate under the guidance of black belts, who have more training and lead more complex projects. Participants in Six Sigma projects typically include five to ten team members from both within and outside the process that is the subject of the Six Sigma project. It can take several months or up to a year or more to go through the steps of the DMAIC process on a Six Sigma project as compared to week-long lean kaizen events. Specific technical tools are used throughout the DMAIC process and are explained in the next section.
Six Sigma Statistical Tools
The Six Sigma toolkit has a number of tools and techniques that help teams work through the Six Sigma DMAIC process. The tools outlined below are divided into two categories: 1) tools that analyze sources of variation and problems in the process, and 2) tools that evaluate potential solutions to improve the process.
Problem Identification and Analysis Tools
The initial phases in the DMAIC process involve analyzing the sources of variation and problems in the process. The following tools are examples of tools that exist to gather data and evaluate the existing process.
- Descriptive Statistics: Statistical tools are used to organize, summarize, and describe data that is collected. The data collected from using statistical tools provide measures of central tendency and measures of dispersion, which are often used as supporting information in the decision-making process.
- 5 Whys Approach: The approach of asking “why” five times is used to explore the cause/effect relationships underlying a particular problem. By applying the 5 Whys method a company can determine a root cause of a defect or problem.
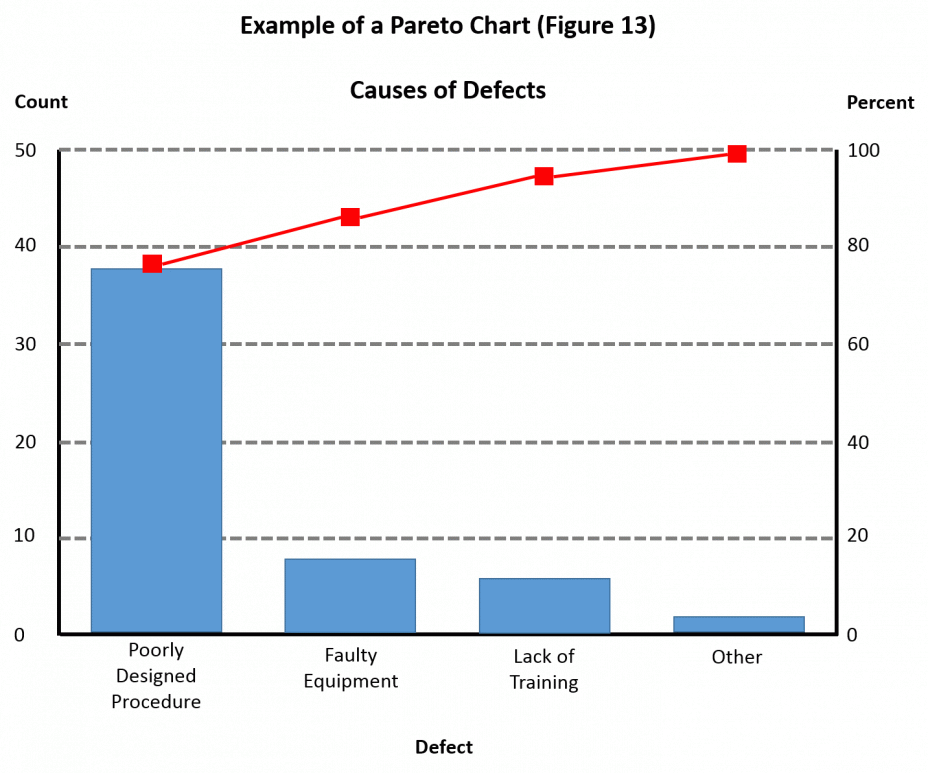
- Pareto Charts: Pareto Charts weigh each type of defect according to severity, cost of repair, and other factors in order to determine which types of defects occur most frequently. The Pareto Chart is a bar graph arranged in descending order of size of importance from left to right. This information facilitates prioritization of response actions. Fundamental to the Pareto principle is the notion that most quality problems are created by a “vital few” processes, and that only a small portion of quality problems result from a “trivial many” processes.
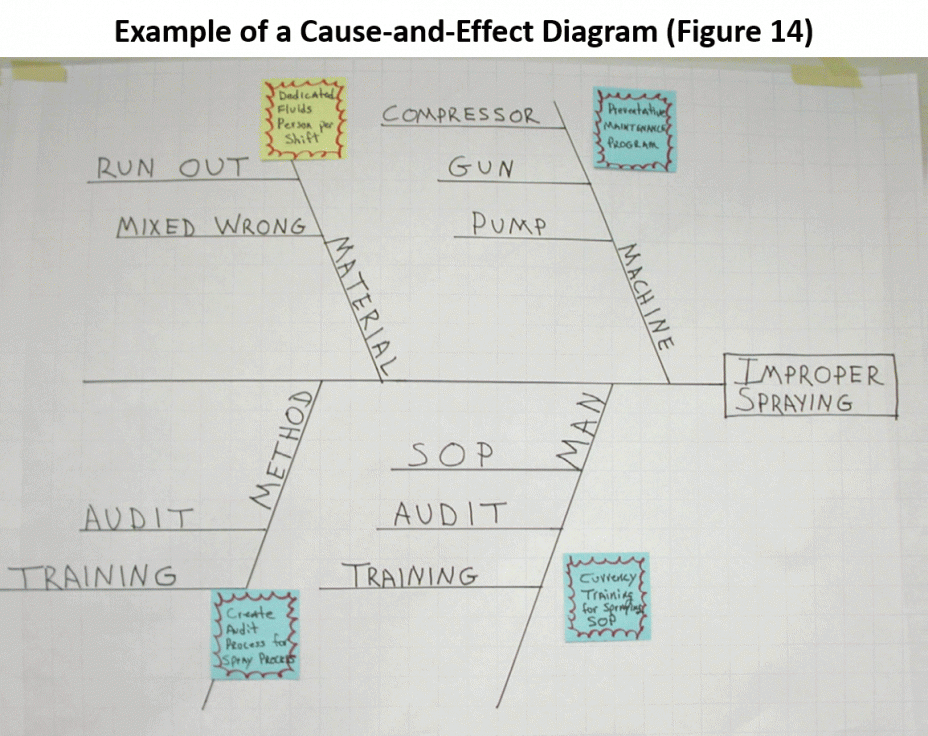
- Cause-and-Effect Diagram: A cause-and-effect diagram is also known as fishbone diagram or an Ishikawa diagram (after its originator, Karoru Ishikawa). This is a useful technique that is used to trigger ideas and promote a balanced approach in group brainstorming sessions where individuals list the causes and effects of problems. Six areas should be considered when constructing a cause-and-effect diagram. The areas (causes) that can contribute to effects are: materials, machine, method, people, measurement, and environment.
Tools for Evaluating Potential Solutions
After identifying and analyzing problems within a process, the next step is to identify and evaluate potential improvement methods. The following tools are used for evaluating solutions.
- Design of Experiments: Design of experiments is an important element in Six Sigma methodology. DOE offers a structured statistical approach to help you understand the factors that affect a process and then create meaningful and effective tests to verify possible improvement ideas or theories. DOE is useful for discovering and validating the relationships between the inputs and outputs in a process, in order to obtain improved results.
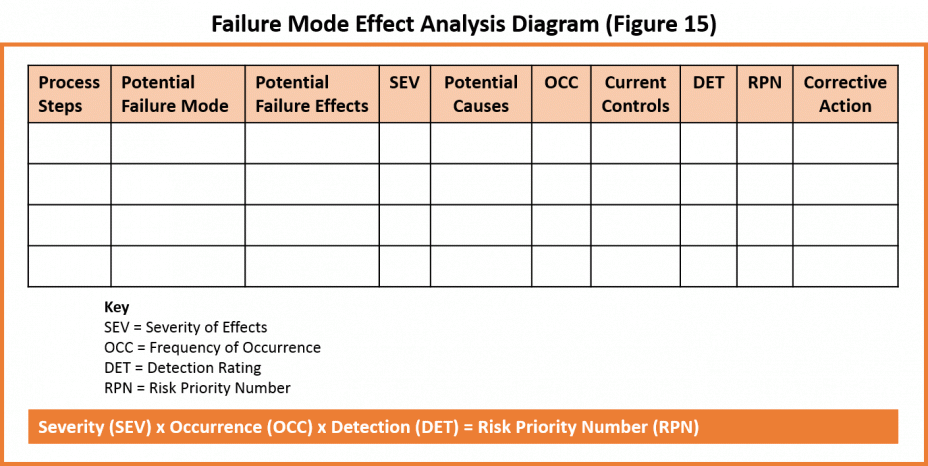
- Failure Mode Effect Analysis (FMEA): FMEA is a technique used to identify potential failure modes or causes of failures that may occur as a result of design or process deficiencies. Teams use FMEA to produce estimates of the effects and level of severity of failures in products or production processes, and to identify options for corrective design or process changes.
Where to Find More Information on Six Sigma
There are numerous publications, training programs, and websites that provide information on Six Sigma principles and methods. For a list of resources, please see Appendix A, Lean and Six Sigma Resources.
Toolkit Navigation
- Contents & Acknowledgements
- Executive Summary
- Chapter 1: Why Lean and Six Sigma Are Important to the Environment
- Chapter 2: What Is Lean?
- Chapter 3: What Is Six Sigma?
- Chapter 4: How Do Lean and Six Sigma Relate to the Environment?
- Chapter 5: Why Does It Matter How We Talk About Lean and Environment?
- Chapter 6: Lean and Environment Applications
- Chapter 7: Conclusion
- Appendix A: Lean and Six Sigma Resources
- Appendix B: Lean and Environment Resources
- Appendix C: Lean and Six Sigma Glossary
- Appendix D: Environmental Glossary
- Appendix E: Summary of the Washington Lean and Environment Pilot Projects


