Policy and Program Impact Estimator: A Materials Recovery Greenhouse Gas (GHG) Calculator for Communities
On this page:
About the Calculator
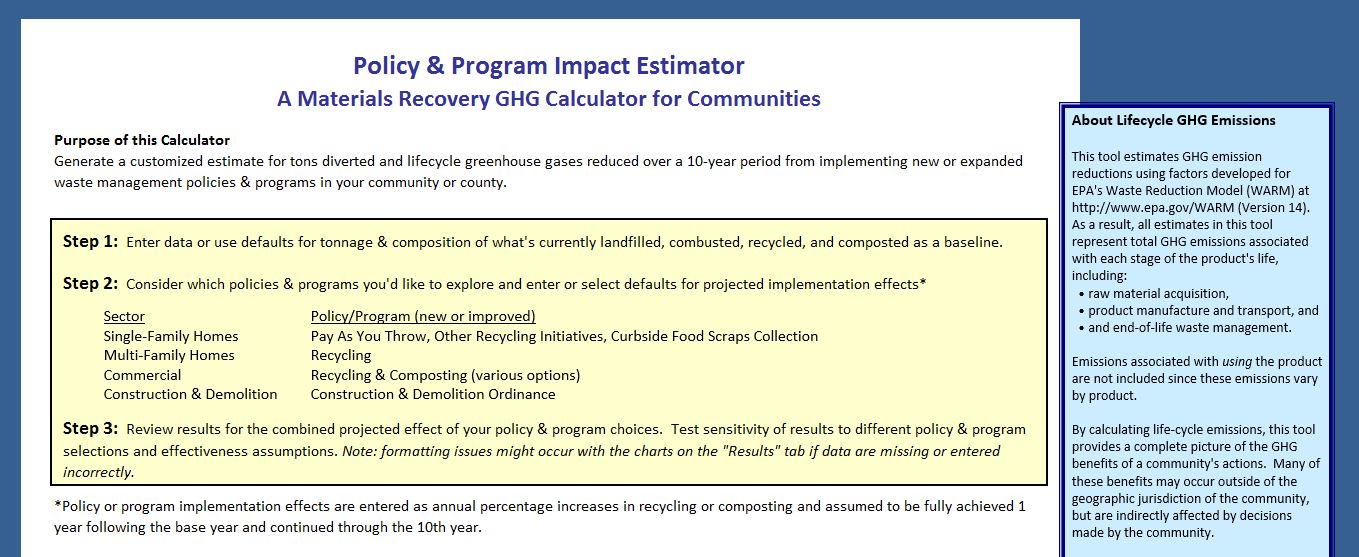 Screenshot of the home page for the Policy and Program Impact Estimator. Click the image to view a larger version.EPA developed a calculator that expands the Waste Reduction Model (WARM) framework to include a community's existing waste stream and policy and program options. This Excel spreadsheet calculator is designed to help municipalities, counties, and tribes estimate reductions in life cycle GHGs from implementing new or expanded solid waste policies and programs in their communities.
Using EPA’s WARM version 14 emissions factors, the calculator generates projected results for annual and accumulative tons of waste diverted and GHGs reduced over a 10-year planning timeframe. The results can inform comparisons of the estimated GHG impact from implementing different policies and programs, consistent with user-entered assumptions.
Materials addressed by the calculator include metal, glass, plastic, paper, wood, food waste, yard trimmings, and various construction and demolition debris materials. The calculator may also serve to familiarize users with what type of local solid waste data is needed to estimate GHG reductions from recycling and composting programs.
Download the Calculator
Access Policy and Program Impact Estimator(1 pg, 1 MB) in Excel.
In order to see a version of the calculator with solid waste data and assumptions filled in, EPA has prepared a scenario using hypothetical data. Download the Example Scenario(17 pp, 1 MB) .
Below is a pie chart generated from this example scenario showing the percentage of metric tons of carbon dioxide equivalent (MTCO2e) saved in the 10th year following policy and program implementation.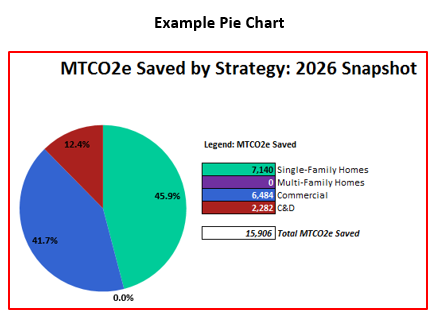 EPA generated this pie chart from the example scenario.
How To Use The Calculator
-
Enter estimates or select defaults for tonnage landfilled, combusted, recycled, and composted within a jurisdictional boundary for a baseline year on the Basic Information and Waste Characterization tabs.
-
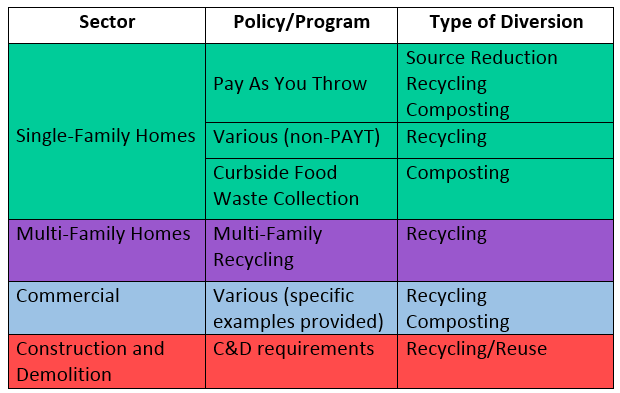
Consider which policies and programs (summarized in the table below) you'd like to include in your implementation scenario. On the appropriate tabs, enter assumptions for projected implementation effects, e.g., percentage increase in recycling. Defaults or guidelines are provided.
-
Go to the Results tab to view the combined projected effect of your policy and program choices in new tons diverted and MTCO2e saved. You may also test sensitivity of the results by changing assumptions for policy and program effectiveness.
-
Use the Printable Charts tab to print or copy and paste results from your implementation scenario into other documents.
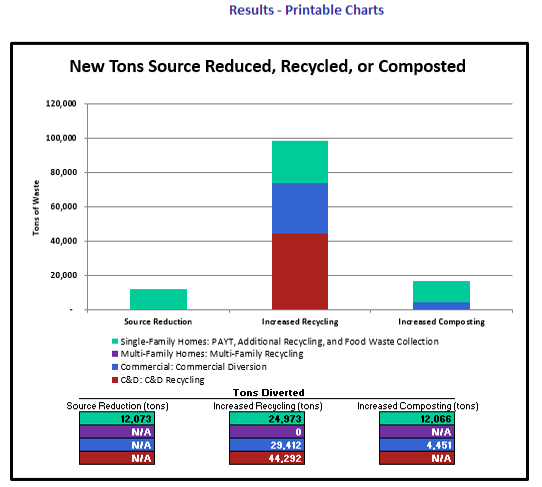 Example of one type of chart that can be printed from the Policy and Program Impact Estimator.