ACE: Health - Childhood Cancer
Indicators
Indicator H4
Data characterization
- Cancer incidence data for this indicator are obtained from a database of 13 regional tumor registries located throughout the country, maintained by the National Cancer Institute.
- The population covered by the 13 registries is comparable to the general U.S. population regarding poverty and education, but is more urban and has more foreign-born persons.
- Cancer mortality data for this indicator are obtained from a database of all death certificates in the United States; cause of death is recorded on the death certificates.
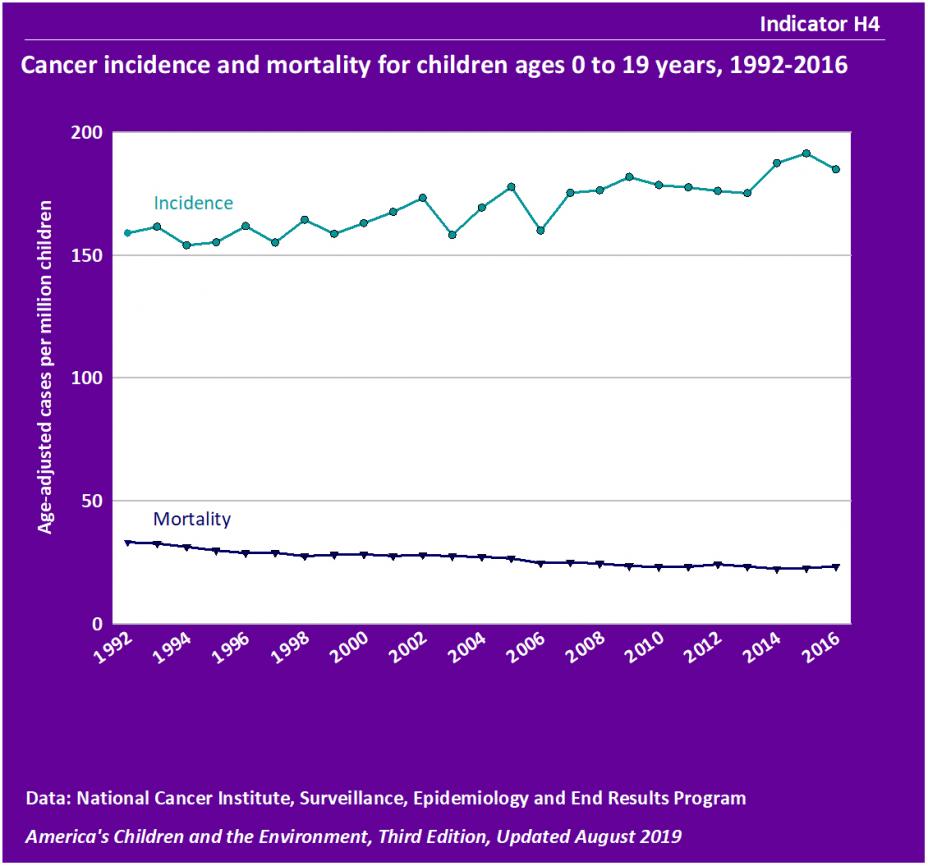
- The age-adjusted annual incidence of cancer ranged from 154 to 161 cases per million children between 1992 and 1994 and from 185 to 191 cases per million children between 2014 and 2016. This increasing trend from 1992-2016 was statistically significant.
- Childhood cancer mortality decreased from 33 deaths per million children in 1992 to 23 deaths per million children in 2016, a statistically significant decreasing trend.
- Childhood cancer incidence and mortality rates were generally higher for boys than for girls. In 2014-2016, rates of cancer incidence and mortality for boys were 196 cases per million and 25 deaths per million, compared with 179 cases per million and 20 deaths per million for girls. These differences by sex were statistically significant for cancer incidence (after adjustment for age and race/ethnicity) and cancer mortality. (See Tables H4a and H4b.)
- In 2014-2016, cancer incidence was consistently greater for boys than girls in each race/ethnicity group. The difference was statistically significant for American Indian and Alaska Native (AIAN) non-Hispanic children and Hispanic children (after adjustment for age). The differences were not statistically significant for other race/ethnicity groups. (See Table H4a.)
- In 2014-2016, cancer mortality was consistently greater for boys than girls in each race/ethnicity group. The difference was statistically significant for White non-Hispanic children, AIAN non-Hispanic children, and Hispanic children. (See Table H4b.)
- In 2014-2016, childhood cancer incidence was highest among White non-Hispanic children at 202 cases per million. AIAN non-Hispanic children had an incidence rate of 176 cases per million, Asian and Pacific Islander (API) non-Hispanic children had an incidence rate of 177 cases per million, Hispanic children had an incidence rate of 182 cases per million, and Black non-Hispanic children had an incidence rate of 142 cases per million (See Table H4a.)
- The cancer incidence rate for White non-Hispanic children was statistically significantly higher than the rates of Black non-Hispanic, API non-Hispanic, and Hispanic children after accounting for differences by age and sex. The cancer incidence rate for Black non-Hispanic children was statistically significantly lower than the rates of API non-Hispanic and Hispanic children after accounting for differences by age and sex. The remaining differences between race/ethnicity groups were not statistically significant.
- Childhood cancer incidence rates vary by age. In 2014-2016, children under 5 and those of ages 15 to 19 years experienced the highest incidence rates of cancer at approximately 227 and 252 cases per million, respectively. Children ages 5 to 9 years and 10 to 14 years had lower incidence rates at 124 and 151 cases per million, respectively. These differences among age groups were statistically significant. (See Table H4c.)
Indicator H5
Data characterization
- Data for this indicator are obtained from a database of 13 regional tumor registries located throughout the country, maintained by the National Cancer Institute.
- The population covered by the 13 registries is comparable to the general U.S. population regarding poverty and education, but is more urban and has more foreign-born persons.
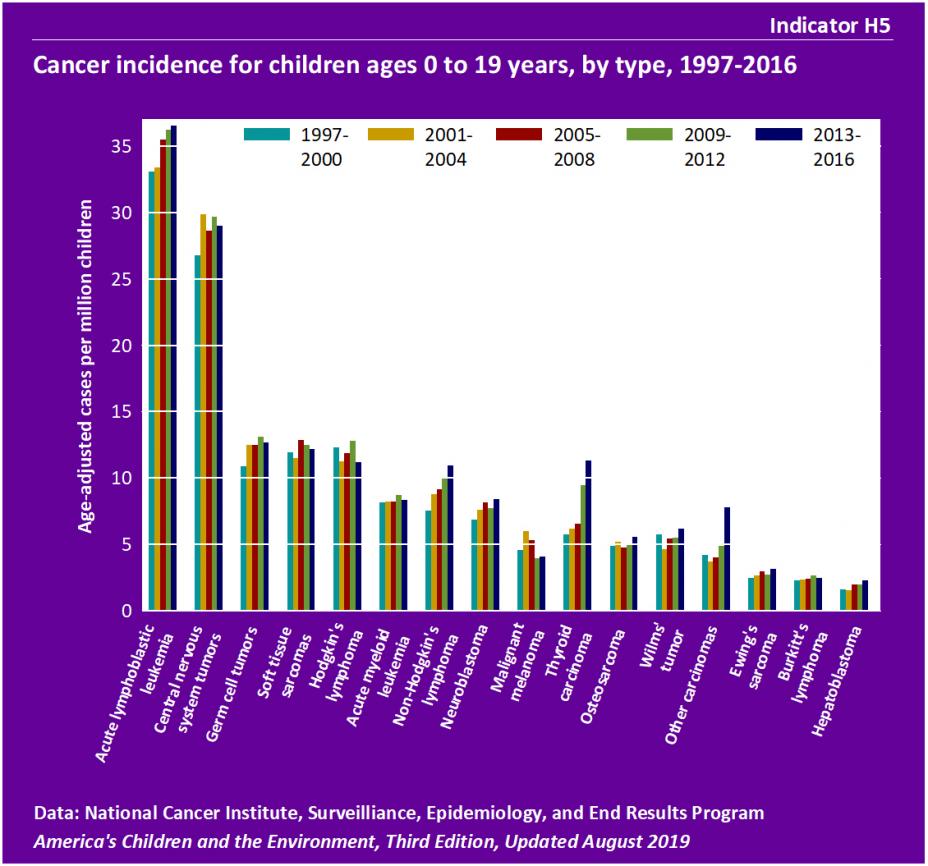
- Leukemia, which includes acute lymphoblastic leukemia and acute myeloid leukemia, was the most common cancer diagnosis for children from 2013-2016, representing 26% of total cancer cases. Incidence of acute lymphoblastic (lymphocytic) leukemia was 33 cases per million in 1997-2000 and 37 cases per million in 2013-2016. The rate of acute myeloid (myelogenous) leukemia was 8.2 cases per million in 1997-2000 and 8.3 cases per million in 2013-2016.
- The increasing trend for incidence of acute lymphoblastic leukemia was statistically significant after accounting for differences by age, sex, and race/ethnicity. The trend for acute myeloid leukemia was not statistically significant.
- Central nervous system tumors represented 17% of childhood cancers in 2013-2016. The incidence of central nervous system tumors was 27 cases per million in 1997-2000 and 29 cases per million in 2013-2016.
- The trend for incidence of central nervous system tumors was not statistically significant.
- Lymphomas, which include Hodgkin's lymphoma, non-Hodgkin's lymphoma, and Burkitt's lymphoma, represented 14% of childhood cancers in 2013-2016. Incidence of Hodgkin's lymphoma was 12.3 cases per million in 1997-2000 and 11.2 cases per million in 2013-2016. There were approximately 8 cases of non-Hodgkin's lymphoma per million children in 1997-2000 and 11 cases per million in 2013-2016. Incidence of Burkitt's lymphoma was 2.3 cases per million children in 1997-2000 and 2.5 per million in 2013-2017.
- The increasing trend in the incidence rate of non-Hodgkin's lymphoma was statistically significant. The was no statistically significant trend in the incidence rates of Hodgkin’s lymphoma and Burkitt’s lymphoma.
- Between the years 1997 and 2016, increasing trends in the incidence of thyroid carcinoma, other and unspecified carcinomas, Ewing’s sarcoma, and hepatoblastoma were statistically significant. The increasing trend in neuroblastomas was statistically significant after accounting for differences by age, sex, and race/ethnicity. There was no statistically significant trend in the incidence rate of germ cell tumors, soft tissue sarcomas, malignant melanomas, osteosarcoma, or Wilms’ tumor (tumors of the kidney).
- Different types of cancer affect children at different ages. The incidence of neuroblastomas and Wilms' tumor was highest for young children (ages 0 to 4 years). Leukemias occur in all age groups, but the incidence is highest among 0- to 4-year-olds. The incidence of Hodgkin's and non-Hodgkin's lymphomas, thyroid carcinomas, malignant melanomas, other and unspecified carcinomas, germ cell tumors, and osteosarcomas was higher in those 15 to 19 years old. Differences among age groups were statistically significant for each of these cancer types. (See Table H5a.)
Background Text
About the Childhood Cancer Indicators
Indicators H4 and H5 present information about new childhood cancer cases and deaths caused by childhood cancer. The data are from various cancer tumor registries in specific geographic regions around the country as well as a national database of vital statistics that collects data on numbers and causes of all deaths each year.
Cancer in childhood is rare compared with cancer in adulthood, but still causes more deaths than any factor, other than injuries, among children from infancy to age 15 years. The annual incidence of childhood cancer has increased slightly over the last 30 years; however, mortality has declined significantly for many cancers due largely to improvements in treatment.
The causes of cancer in children are poorly understood, though in general it is thought that different forms of cancer have different causes. According to scientists at the National Cancer Institute, established risk factors for the development of childhood cancer include family history, specific genetic syndromes (such as Down syndrome), high levels of radiation, and certain pharmaceutical agents used in chemotherapy. A number of studies suggest that environmental contaminants may play a role in the development of childhood cancers. The majority of these studies have focused on pesticides and solvents, such as benzene. According to the President’s Cancer Panel, “the true burden of environmentally induced cancer has been grossly underestimated.”
Indicators H4 and H5 present data on childhood cancer incidence and mortality from the National Cancer Institute’s Surveillance, Epidemiology, and End Results (SEER) Program.
More information about childhood cancer and Indicators H4 and H5 is provided in the updated Childhood Cancer section of America's Children and the Environment, Third Edition.
Related Links
National Cancer Institute (NCI): Childhood Cancer
National Cancer Institute (NCI): Reducing Environmental Cancer Risk - What We Can Do Now (PDF)
National Cancer Institute (NCI): SEER Cancer Statistics Review
Methods
Summary of Methods - Childhood Cancer
The National Cancer Institute's Surveillance, Epidemiology, and End Results (SEER) Program collects and publishes data on cancer incidence, survival, and prevalence. SEER obtains its cancer case data from population-based cancer registries that currently cover a total of 17 geographical areas in the United States and one quarter of the population. SEER obtains its cancer mortality data from a national database of vital statistics that collects data on numbers and causes of all deaths each year.
Indicator H4 uses the SEER data to present childhood cancer incidence and mortality for children ages 0 to 19 years. Indicator H5 uses the SEER data to present the number of childhood cancer cases reported for children ages 0 to 19 years, stratified by type. The incidence rate is age-adjusted, meaning that each year's incidence calculation uses the age distribution of children from the year 2000. Some types of childhood cancers are very rare, and as such the yearly incidence is particularly low and variable. Due to this fact, Indicator H5 shows the incidence of individual childhood cancers in groupings of four years.
Detailed Methods for Indicators H4 and H5
Metadata for National Cancer Institute's Surveillance, Epidemiology, and End Results (SEER) Program