ACE: Health - Obesity
Indicators
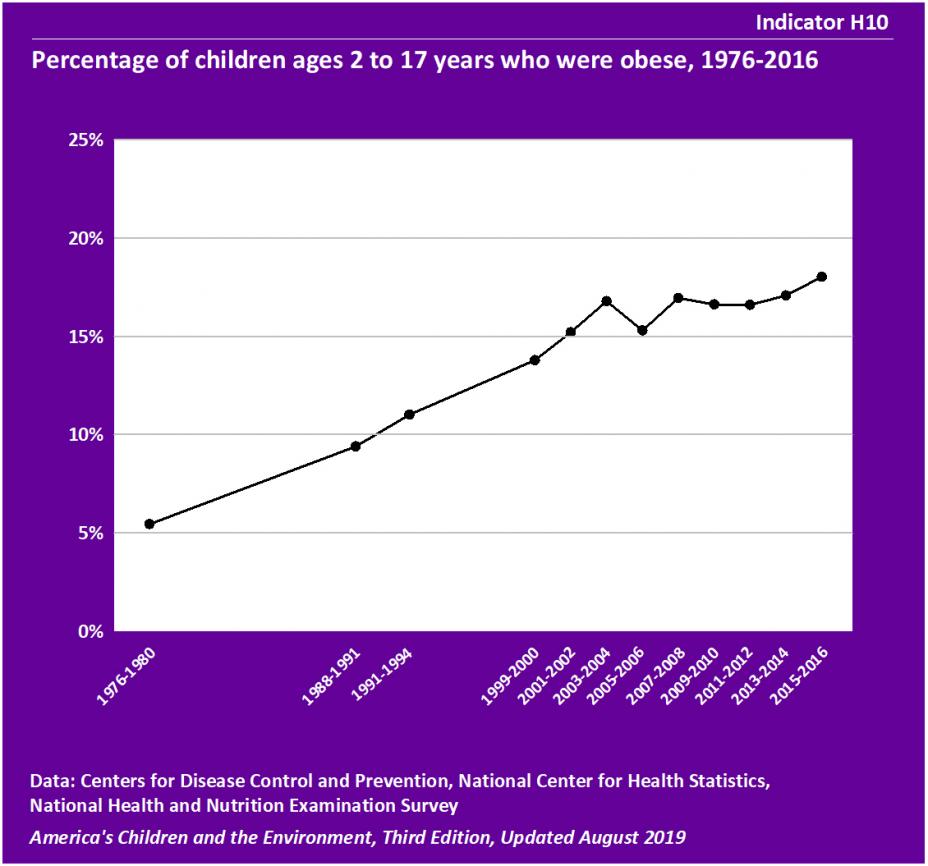
Indicator H10
![]()
Data characterization
- Data for this indicator are obtained from an ongoing continuous survey conducted by the National Center for Health Statistics.
- Survey data are representative of the U.S. civilian noninstitutionalized population.
- Height and weight are measured in individual survey participants.
- Between 1976-1980 and 2015-2016, the percentage of children identified as obese showed an increasing trend. In 1976-1980, 5% of children ages 2 to 17 years were obese. This percentage reached a high of 18% in 2015-2016. Between 2001-2002 and 2015-2016, the percentage of children identified as obese remained between 15% and 18%.
- From 1976-2016, the increasing trend in prevalence of obese children was statistically significant for children overall, and for children of each race/ethnicity and age group. From 1999-2016, the trends were only statistically significant for children overall, ages 11-15 years, ages 16-17 years, and Mexican-American children. (See Table H10 and Table H10a)
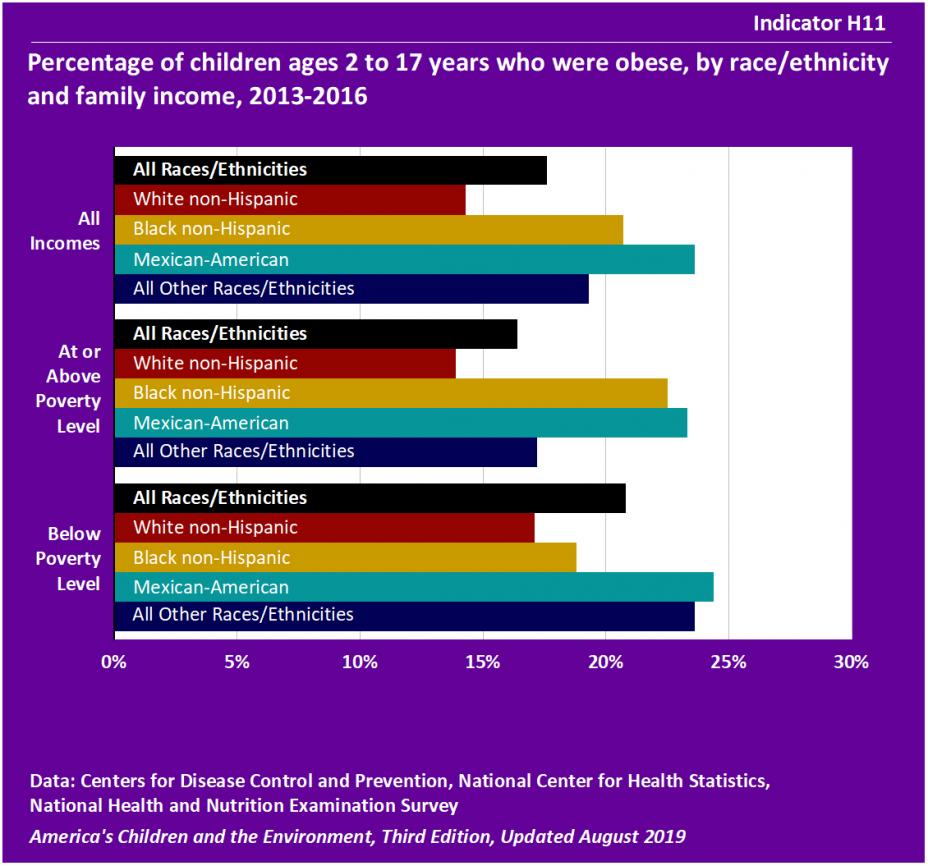
Indicator H11
![]()
Data characterization
- Data for this indicator are obtained from an ongoing continuous survey conducted by the National Center for Health Statistics.
- Survey data are representative of the U.S. civilian noninstitutionalized population.
- Height and weight are measured in individual survey participants.
- In 2013-2016, 18% of children ages 2 to 17 years were classified as obese.
- In 2013-2016, 14% of White non-Hispanic children were obese, compared with 24% of Mexican-American children, 21% of Black non-Hispanic children, and 19% of children of “All Other Races/Ethnicities.”
- The lower prevalence of obesity among White non-Hispanic children compared with each of the other three groups was statistically significant, as was the difference in prevalence between Mexican-American children and children of “All Other Races/Ethnicities.”
- Among children overall, the prevalence of obesity was greater in children with family incomes below poverty level than in those above poverty level. However, when accounting for differences by age and sex, children of “All Other Races/Ethnicities” were the only race/ethnicity group to have a statistically significant association between low family income and higher prevalence of obesity.
Background Text
About the Obesity Indicators
Indicators H10 and H11 present information about obesity in children. The data are from a national survey that measures weight and height in a representative sample of the population every two years.
Obesity is the term used to indicate the high range of weight for an individual of given height that is associated with adverse health effects. Body mass index (BMI) is the most common screening measure used to determine whether an individual may be overweight or obese. Children and adolescents greater than or equal to the 95th percentile of BMI-for-age are considered obese.
Obesity has rapidly become a serious public health concern in the United States, and is associated with several adverse health effects in childhood and later in life, including cardiovascular disease risk factors, cancer, psychological stress, asthma, and diabetes. Increased caloric intake and reduced physical activity are likely the major drivers of obesity in children. Researchers are also investigating whether exposures to certain environmental chemicals may play a contributing role in childhood obesity. In addition, multiple reviews of the literature have concluded that several properties of the built environment may be associated with overweight and obesity and/or levels of physical activity in children.
Indicators H10 and H11 present data on obesity in children from the National Health and Nutrition Examination Survey (NHANES).
More information about obesity and Indicators H10 and H11 is provided in the Obesity section of America's Children and the Environment, Third Edition.
Related Links
Centers for Disease Control and Prevention (CDC): About BMI for Children and Teens
Centers for Disease Control and Prevention (CDC): Overweight and Obesity
Data Resource Center for Child and Adolescent Health: Obesity and OverweightExit
National Institutes of Health (NIH): Strategic Plan for NIH Obesity Research
Methods
Summary of Methods - Obesity
The National Center for Health Statistics, a division of the Centers for Disease Control and Prevention, conducts the National Health and Nutrition Examination Surveys (NHANES), a series of U.S. national surveys of the health and nutrition status of the noninstitutionalized civilian population. Interviews and physical examinations are conducted with approximately 10,000 people in each two-year year survey cycle. Height and weight are measured for survey participants of all ages.
Indicator H10 uses the NHANES data to present the percentage of children ages 2 to 17 years who were obese. Indicator H11 uses the NHANES data to present the percentage of children ages 2 to 17 years who were obese, stratified by race/ethnicity and family income. Body mass index (BMI) is calculated as an individual's weight in kilograms divided by the square of his or her height in meters. The BMI number is compared with an age- and sex-specific reference population based on the 2000 CDC growth charts. Children and teenagers with BMIs at or above the 95th percentile on the growth charts are classified as obese.
Detailed Methods for Indicators H10 and H11
Metadata for National Health and Nutrition Examination Surveys (NHANES)