Multiple-Tumor Analysis with MS_Combo Model (Use with BMDS Wizard)
ICF no longer offers or supports BMDS Wizard.
The BMDS MS_Combo model can be run directly from BMDS or from within the Wizard (versions 1.9 and up). Using the Wizard spreadsheets to run both the individual multistage and MS_Combo models is usually more convenient and faster than using BMDS. This quick start page walks you through the basics of setting up and using the MS_Combo Wizard for analysis.
Note: Before performing this analysis, it is strongly recommended that you review the BMDS Technical Guidance on choosing the appropriate stage of a multistage model for cancer modeling.
The MS_Combo model provides BMD![]() BMDAn exposure due to a dose of a substance associated with a specified low incidence of risk, generally in the range of 1% to 10%, of a health effect; or the dose associated with a specified measure or change of a biological effect. and BMDL
BMDAn exposure due to a dose of a substance associated with a specified low incidence of risk, generally in the range of 1% to 10%, of a health effect; or the dose associated with a specified measure or change of a biological effect. and BMDL![]() BMDLA lower one-sided confidence limit on the BMD. estimates for the risk of getting one or more tumors for any combination of tumors observed in a single bioassay.
BMDLA lower one-sided confidence limit on the BMD. estimates for the risk of getting one or more tumors for any combination of tumors observed in a single bioassay.
The model calculates composite risk: the risk of developing any combination of tumors at any site -- not the risk of developing tumors at every site considered. The model assumes the tumors are independent of each other.
The MS_Combo model generates computed results only. It does not generate a plot or graph.
Exercise 1 - Cancer Data
For this exercise, you will model multiple tumors using two BMDS Wizard templates: the dichotomous-cancer and the MS_Combo.
- Step 1 - You will first use three BMDS Wizard dichotomous cancer worksheets to model individual tumor types with the multistage model to determine which degree model best fits the data. This allows individual tumors to be fit with models that best characterize their specific dose-response shapes.
-
Step 2 - Then, you will use the BMDS Wizard MS_Combo worksheet to run an MS_Combo modeling session and view the results.
Step 1 - Run the Multistage Models
- Create a working directory on your hard drive to hold the files you will use for this exercise.
- Download and open these three BMDS Wizard files: dataset_1.xlsm (Microsoft Excel)(1 pg, 740 K) , dataset_2.xlsm (Microsoft Excel)(1 pg, 740 K) , and dataset_3.xlsm (Microsoft Excel)(1 pg, 740 K) .
- For each file, go to the Main worksheet. You can change the Output File Directory to the working directory. Click AUTORUN.
- Compare the results tabs of all three worksheets.
Question 1
Which model would you choose for each individual tumor?
dataset_1 – Multistage Cancer 1 (Lowest BMDL and lowest Akaike Information Criteria![]() Akaike Information CriteriaA statistical procedure that provides a measure of the goodness-of-fit of a dose-response model to a set of data. AIC = -2 x (LL - p), where LL is the log-likelihood at the maximum likelihood fit, and p is the degrees of freedom of the model (usually, the number of parameters estimated). (AIC))
Akaike Information CriteriaA statistical procedure that provides a measure of the goodness-of-fit of a dose-response model to a set of data. AIC = -2 x (LL - p), where LL is the log-likelihood at the maximum likelihood fit, and p is the degrees of freedom of the model (usually, the number of parameters estimated). (AIC))
dataset _2 – Multistage Cancer 1 (BMDL and AIC are the same for all multistage cancer models)
dataset _3 - Multistage Cancer 1 (BMDL and AIC are the same for all multistage cancer models)
When the BMDS Wizard recommends all multistage models for the endpoint, it typically means the higher degree models have defaulted to the 1st degree model (meaning the b2 and b3 parameters have been estimated to equal 0). However, the user should make sure that the modeling results for the 3rd and 2nd degree models are exactly the same as the results for the 1st degree model. In some instances, although the b2 and b3 parameters are estimated to equal 0, a larger parameter space has been searched, which can result in a lower BMDL or a higher BMDU. In the situation where a higher degree multistage model has exactly the same parameter values as a lower degree model, but a lower BMDL, the higher degree model should be selected.
In all cases, you should follow the technical guidance on choosing the appropriate stage of a multistage model for cancer modeling.
Question 2
If your dose response analysis depended on selecting one tumor type as the critical effect, which tumor type (tumor 1, 2, or 3) would you choose? What would be the recommended BMDL?
Tumor 1, with a BMDL of 657
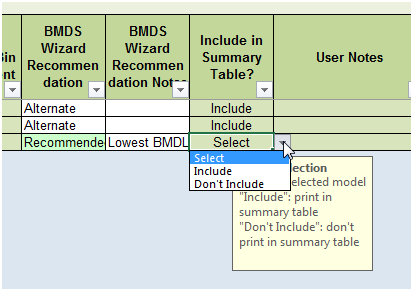
- For each worksheet, go to the Results tab. In the "Include in Summary Table?" column, locate the preferred model's row, and click to change the cell value from Include to Select. The MS_Combo worksheet will use the Select model for its calculations.
Step 2 - Run the MS_Combo Model
- Open the BMDS_MSComboWizard.xlsm template file and save a copy to your working directory as "qs_mscombo.xlsm".
- Click 2) Select BMDS Directory to locate and enter the directory where BMDS 2.5 (or higher) is installed.
- Click 3) Select Wizard Directory to locate and enter the working directory containing the Wizard files for the individual tumors.

- Click in the 4) Input Filename (*.tum) cell. Enter a filename for the multitumor (*.tum) file that the Wizard will create and send to the BMDS application for processing. The Wizard will also create a corresponding output file (*.out). Example: Enter "qs_exercise" for the .tum filename, and the Wizard will automatically display "qs_exercise.out".

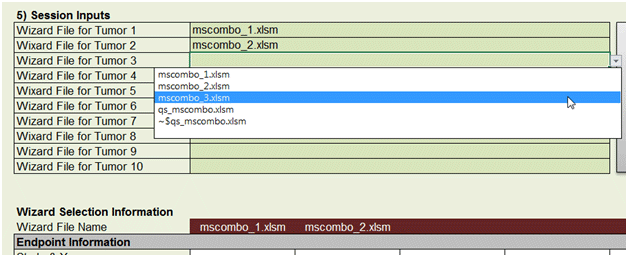
- In the 5) Session Inputs section, click in a cell to display the Wizard filenames in the working directory. Select the appropriate file for each cell.
Note: Look in the Wizard Selection Information section just below the Session Inputs. You'll see the file names appear at the top of each column.
- Click 6) Get Tumor Information. The Wizard opens each specified file, gathers the data about the Selected model for each endpoint, and transfers that data to the Wizard Selection Information section of the MS_Combo worksheet.
The ERRORS! and VALIDATION WARNINGS boxes notify you of any problems identified with the files, such as if no model was Selected for an endpoint. In this case, you may see warnings such as "Endpoints have been selected from multiple studies" and "Please fill in all user inputs". Despite the validation warnings, the Wizard will run the MS_Combo model to completion.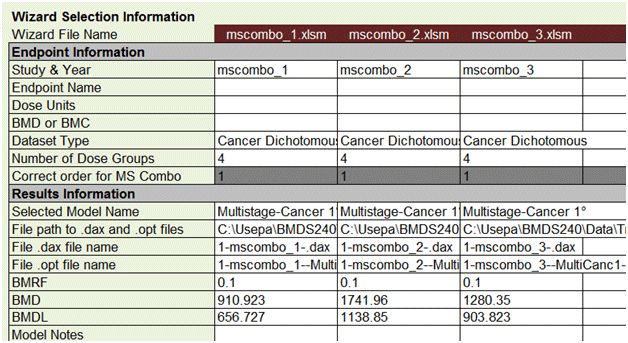
- Enter User Inputs, which are located at the bottom of the Wizard Selection Information section. Here, you can enter information on the species, sex, and tissue for each endpoint. You can enter whatever you like here, but the same values must be entered for all three tumors. Click 6) Get Tumor Information again to see if there are any further validation messages.

- Click buttons (A) through (C) at the top of the sheet to step through the process of creating a BMDS session file, running the BMDS session, and importing the results into the MS_Combo Wizard worksheet. Click OK at the information windows to acknowledge the creation of the .tum file and the BMDS run.
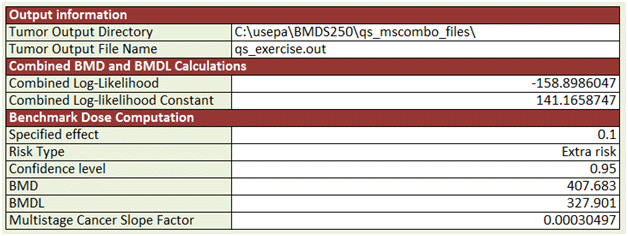
- Click (D) Import Results to display the Results worksheet. You can also click the View Output File button to see the formatted BMDS results.
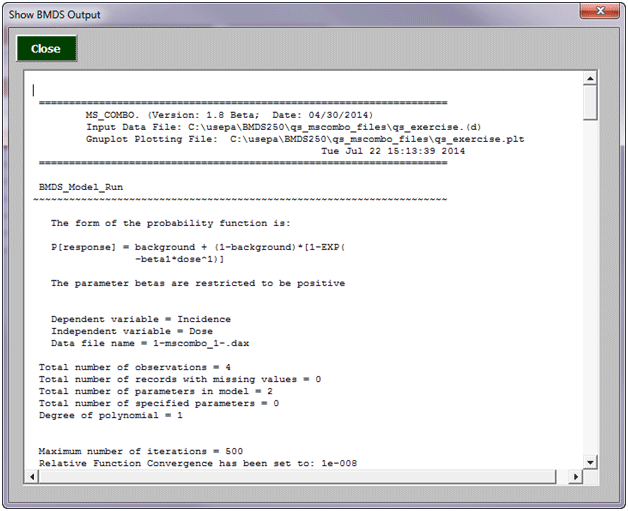
Question 3
Compare the results of the MS_Combo run to the individual results of the three multistage worksheets. How do the MS_Combo results compare to the individual tumor results and why?
The BMDL for the MS-Combo model (327.901) is lower than the BMDLs for the individual models (656.727, 1138.85, and 903.823 for mscombo_1, mscombo_2, and mscombo_3, respectively). This is because the MS_Combo model is calculating the risk of developing ANY combination of tumors.
Exercise 2 - Cancer Data
Step1 - Run the Multistage Models
- Download and open the following Wizard dichotomous cancer files: lung.xlsm (Microsoft Excel)(1 pg, 822 K) , liver.xlsm (Microsoft Excel)(1 pg, 813 K) , and kidney.xlsm (Microsoft Excel)(1 pg, 816 K) .
- For each file, select the BMDS Installation directory and the desired Output file directory
- For each file, click AUTORUN.
- For each file, on the Results tab , in the "Include in Summary Table?" column, locate the preferred model's row, and click to change the cell value from Include to Select.
Question 1
What is the AIC value associated with this model run?
1049.33
Step 2 - Run the MS_Combo Model
- Open the BMDS_MSComboWizard.xlsm template file and save a copy to your working directory as "qs_mscombo_ex2.xlsm".
- Specify the BMDS Installation directory and the Wizard directory.
- In the 4) Input Filename section, enter a name for the .tum file that BMDS will use to run the MS_Combo model.
- In the 5) Session Inputs section, select the three individual Wizard files from Step 1.
- Click 6) Get Tumor Information.
- Fill in User Inputs for species and sex.
- Click buttons (A) through (C) at the top of the sheet to step through the process of creating a BMDS session file, running the BMDS session, and importing the results into the MS_Combo Wizard worksheet. Click OK to acknowledge the creation of the .tum file and the BMDS run.
- Click (D) Import Results to display the Results worksheet. You can also click the View Output File button to see the formatted BMDS results.
Question 2
Compare the model results from the three dichotomous cancer files and the MS_Combo file to the results below.
| Lung | Liver | Kidney | MS_Combo | |
|---|---|---|---|---|
| Degree Multistage | 2nd | 1st | 2nd | n/a |
| BMD10 | 25.1 | 12.5 | 15.5 | 6.48 |
| BMDL10 | 14.4 | 9.75 | 9.47 | 4.5 |
| CSF | 0.0069 | 0.0103 | 0.0106 | 0.0222 |
| AIC | 150.07 | 151.88 | 157.62 | n/a |
| p value | 0.259 | 0.752 | 0.276 | n/a |
| Scaled residual | 0.773 | -0.407 | -0.705 | n/a |

