Using Benchmark Dose Software (BMDS) v2.7 to Quickly Evaluate a Single Dichotomous Dataset
BMDS 2.7 is no longer under active development. Please upgrade to BMDS 3.0.
This exercise introduces you to the BMDS application interface and shows how to quickly evaluate a single dichotomous dataset. You can use the same process to evaluate a continuous dataset.
Refer to the online training for deeper information on dichotomous BMD model concepts and the technical guidance document for specific guidelines on selecting and reporting.
The approach for selecting a "best" modeling result described on this page applies to noncancer analyses only. You should review the technical guidance for choosing the appropriate stage of a Multistage model for cancer modeling.
Note: BMDS includes several sample files in the application’s Data subdirectory; the filenames end with the “.dax” extension (the default for data saved within BMDS). You can use those files to try out other BMDS functions.
- Start up BMDS.
- From the menu bar, select File>New>Dataset (.dax)>Dichotomous Data. An empty data grid window opens in the BMDS application window, as shown in the following screenshot. Note that the first three column labels correspond to a typical dichotomous dataset.
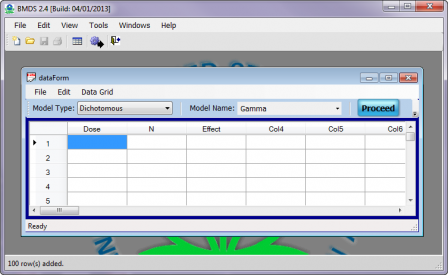
BMDS automatically sets the Model Type to Dichotomous. From the Model Name picklist, select Multistage. (Refer to the BMDS Help File/User Guide section “Model Descriptions” for more detailed information on each model and the associated model types.)
-
Enter the numbers from the following table into the data grid. The quick way: copy the rows of numbers below and paste them into the BMDS data grid. (You can also copy and paste numbers from Excel spreadsheets.)
| Dose | N | Effect |
|---|---|---|
| 0 | 50 | 0 |
| 1000 | 50 | 2 |
| 3000 | 50 | 6 |
| 8000 | 50 | 25 |
Note: A cell in the Data Grid should never be blank or have extra spaces before or after a number. If there is no value for an item, then enter 0 (zero).
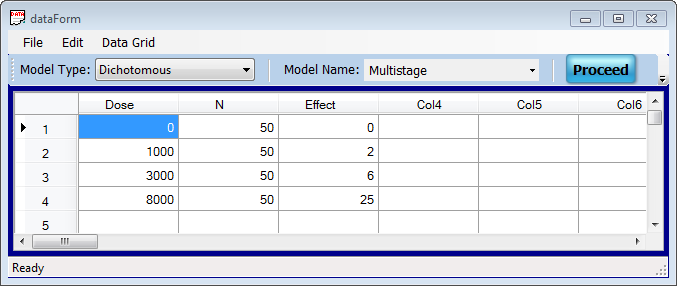
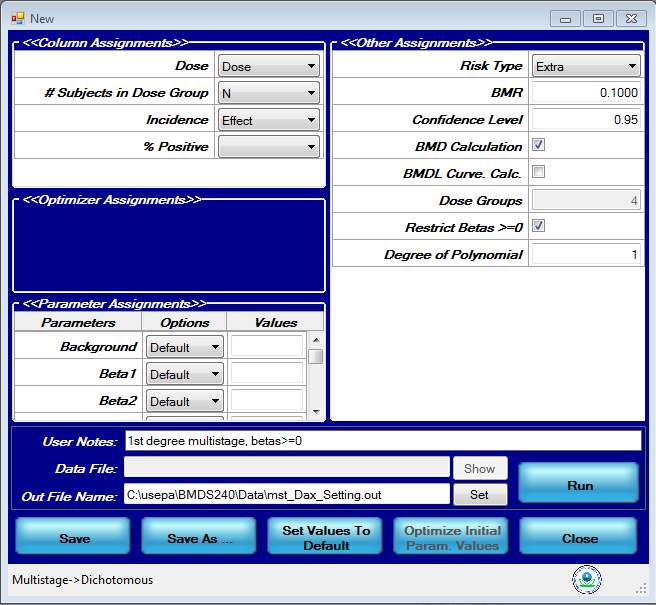
- Click the Proceed button. The Model Options dialog for Multistage Dichotomous datasets opens (see following screenshot). Each Model Options dialog contains features unique to the model you’ve selected. From this dialog, you specify the variables in your dataset and any options or parameters you want applied when BMDS runs the model on your dataset.
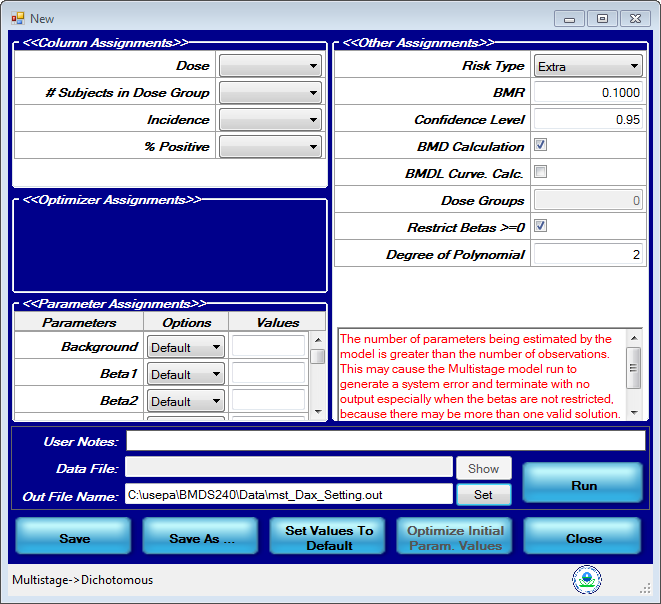
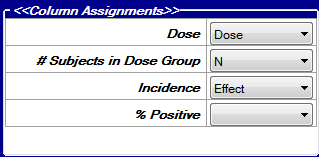
- In the Column Assignments section, specify the columns holding the dataset variables. Select the appropriate column headers for each variable. (Note that the red warning text in the Other Assignments box goes away.) The Column Assignments box should look like the following screenshot when you’re done:
- The Parameter Assignments section lets you tweak initial parameter values for the model. For this exercise, we leave the parameters settings at Default, meaning that BMDS will manage the initial parameter estimations.
- In the Other Assignments section:
- Ensure the Restrict Betas>=0 is checked. This restricts the beta coefficients to be greater than or equal to zero.
- Change the Degree of Polynomial field to 1. This means you’ll run a 1st-degree multistage polynomial (i.e., linear) model on the data.
- In the User Notes field, enter “1st degree multistage, betas >=0.”
- In the Out File Name field, you can change the name of the .out file (the text-based results report). You can change the path in this field also, but the directory needs to already exist. For now, leave this field unchanged.
- Note that you can click Save to save the selections you’ve made on this Model Options dialog to an .opt file you can use again later. Click Save As if you want to create variations on these options that you want to use later.
Your Model Options dialog should resemble the following screenshot:
-
Click the Run button. In a few seconds, BMDS displays graphical and text results. You should see a window similar to the following screenshot:
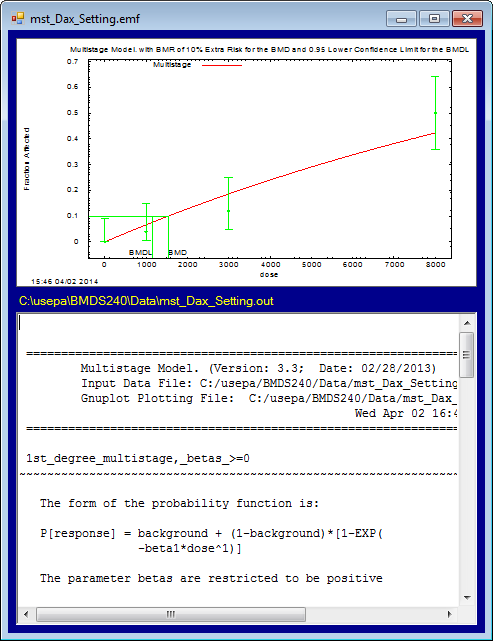
A BMDS result window consists of a plotted graph for the model plus its Out File text-based results display. Note that BMDS displays the path and filename information above each graph and out file.
Scroll through the .out text results to see a typical BMDS model analysis report. Scroll to the end of the report to see the calculated BMD and BMDL numbers.
Note that you can right-click on the graph to copy it to the clipboard; with the graph on the clipboard, you can paste it into a document.
BMDS plots are saved as .plt files. Selecting Tools>View Plot File will allow you to view any existing .plt file using the plot-generating software called GnuPlot. (GnuPlot is included as part of the BMDS install package.) Plots can be edited within GnuPlot or copied and pasted into other software, such as Microsoft PowerPoint, for further editing.
For more information on viewing, editing, and exporting results, please refer to the BMDS Text and Graphics Output quick start. In the BMDS 2.7 User Manual/help file, refer to the section "Working with Reports and Output."
Going Further
Run the model with Degrees of Polynomial set to 2 and 3 (for 2nd and 3rd degree multistage polynomial model). Compare the Akaike Information Criteria![]() Akaike Information CriteriaA statistical procedure that provides a measure of the goodness-of-fit of a dose-response model to a set of data. AIC = -2 x (LL - p), where LL is the log-likelihood at the maximum likelihood fit, and p is the degrees of freedom of the model (usually, the number of parameters estimated). (AIC) results and BMDL
Akaike Information CriteriaA statistical procedure that provides a measure of the goodness-of-fit of a dose-response model to a set of data. AIC = -2 x (LL - p), where LL is the log-likelihood at the maximum likelihood fit, and p is the degrees of freedom of the model (usually, the number of parameters estimated). (AIC) results and BMDL![]() BMDLA lower one-sided confidence limit on the BMD. values from all three runs: which BMDL would you choose from these three runs?
BMDLA lower one-sided confidence limit on the BMD. values from all three runs: which BMDL would you choose from these three runs?
Using BMDS, you have to run the model three times to find the lowest BMDL. However, you can use BMDS Wizard to easily run the 1st, 2nd, and 3rd degree multistage polynomial models at one time. The next exercise describes how to use the BMDS Wizard to do just that.
The approach for selecting a "best" modeling result described on this page applies to noncancer analyses only. You should review the technical guidance for choosing the appropriate stage of a Multistage model for cancer modeling.
Next: Setting Up & Using BMDS Wizard – Tips and Best Practices
