Computing Inferences: Categorical Tolerance Data
Categorical Tolerance Data
To demonstrate this approach, curve classification was used to assign genera to tolerance categories with respect to elevated temperature, using data collected in the EMAP-West study. These tolerance categories were then used to compute the richness, proportion of total taxa, and relative abundance of sensitive and tolerant taxa in an independent dataset, collected from western Oregon. In the example shown below, the relative abundances of high temperature sensitive and high temperature tolerant taxa are plotted versus observed stream temperature in OR.
Relatively strong relationships were observed between each of the metric values and the observed stream temperature (Figure 21). In general, the metrics for sensitive taxa exhibited less variability in their relationships with the measured environmental condition than the metrics for tolerant taxa. This difference may be a result of differences in the total number of taxa that are classified as sensitive versus tolerant.
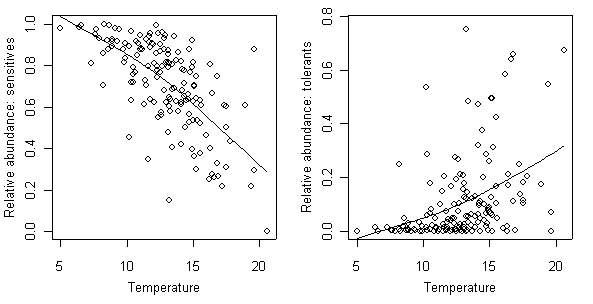 Figure 21. Relationship between the relative abundance of high temperature sensitive (left) and high temperature tolerant (right) taxa and stream temperature (°C) in Oregon. Solid line shows position of a smoothing spline fit through the data.