Chemicals Dashboard Help: Chemical Properties
Chemical Properties
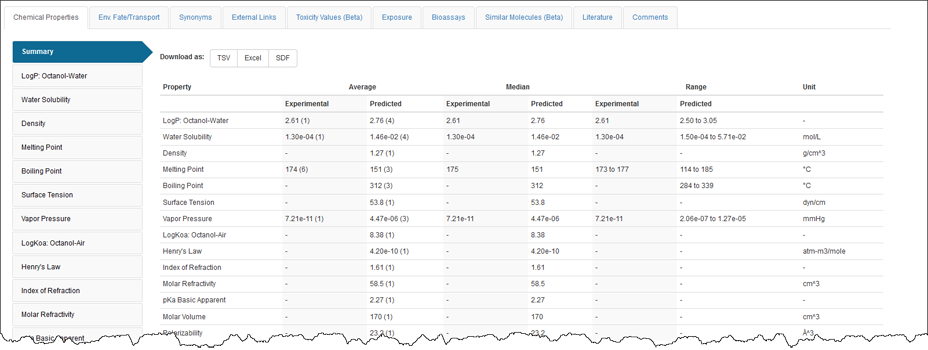
The Chemical Properties listed in the table include both experimental and predicted property data. The experimental data are sourced from various sources including data curated from PHYSPROP downloadable files (explained in detail in the paper by Mansouri et al) as well as data from other public websites. Five forms of predicted property data are available. These include data from EPISuite, from the OPERA models (Mansouri et al. publication in preparation), from the NICEATM models (Zang et al, manuscript accepted for publication), from the Toxicity Estimation Software Tool (TEST) Models and harvested from the Open PHACTS project as predicted by ACD/LabsExit. The summary tab displays a table with a list of all available properties and, if available, the average experimental property and range of experimental properties. The numbers in parentheses indicate the number of each of the properties available.
For the example above, the Average Melting Point is listed as 174 (6) indicating that there are 6 melting points available covering a range of 173 to 177 degrees. Clicking on the individual property button on the left hand side opens up a detailed property table for review. The table of Melting Points listed below shows the information for Atrazine. Hovering over the Source names will display details regarding the Source information.
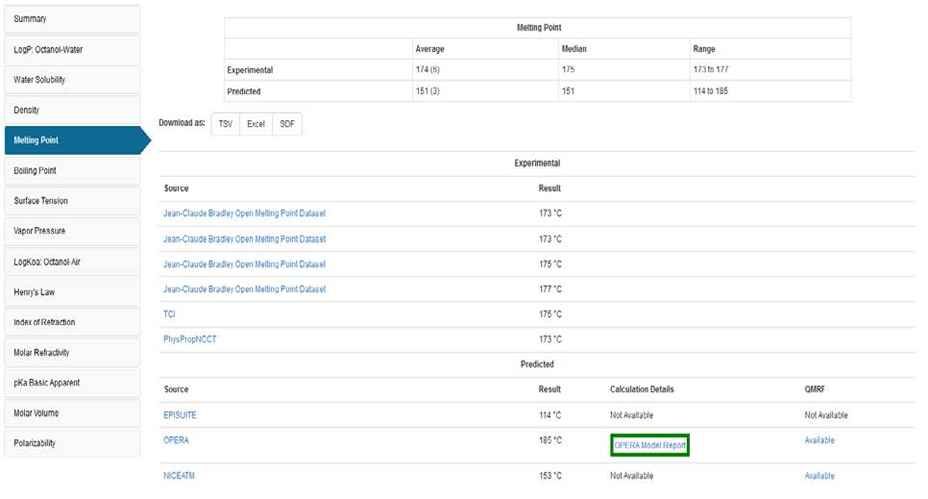
In both cases, the summary table of properties and the detailed table of values, it is possible to download the file in either tab-separated value (TSV), Excel table format or as a Structure Data File (SDF).
In order to deliver total transparency in terms of how the property predictions are performed a report regarding the Calculation Details is available for the OPERA calculations. An example is shown here for Atrazine and is displayed below.
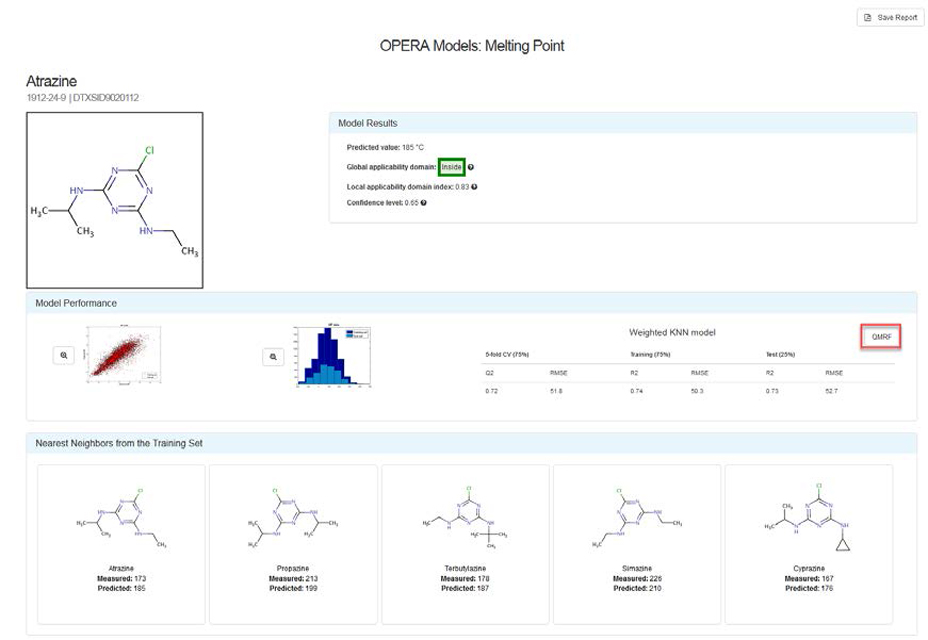 The details regarding how the prediction models were developed are given in the QMRF report that is directly available as a PDF file that can be downloaded. Each of the available OPERA models has its own QMRF detailing the software used to develop the models as well as the individual descriptors parameterizing a specific property. In the Calculation Report shown above the predicted value is the value produced by the prediction model and the Global Applicability Domain describes whether the chemical structure is contained Inside or Outside of the domain. The Local Applicability Domain Index is a value between 0 and 1 based on the similarity between the structure and its five nearest neighbors. The Confidence level, a value between 0 and 1, is an accuracy index of prediction based on the five nearest neighbors. More details are contained within the QMRF report.
Detailed prediction reports are available from the TEST predictors. An example is shown here.