Chemicals Dashboard Help: Exposure
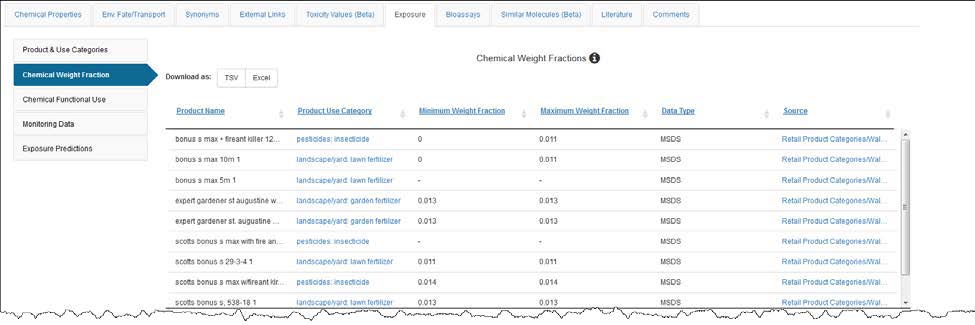
The Exposure tab provides a listing of products containing the chemical, percent composition of the chemical in the product and associated suppliers from the CPCat Database. The data can be downloaded in either TSV or Excel format. For details regarding each of the tables and how the data are sourced click on the informational icon adjacent to the title for details.
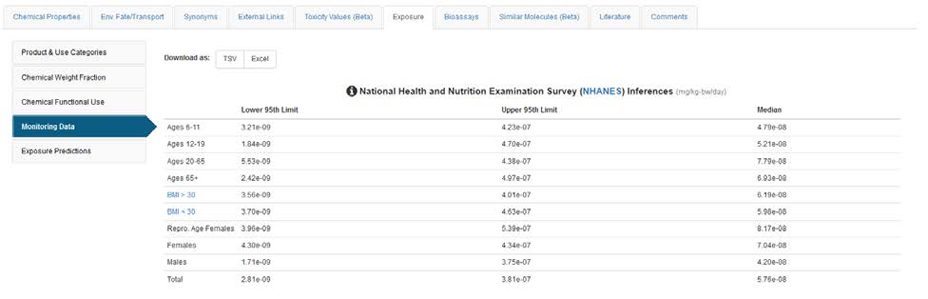
NHANES: The Centers for Disease Control (CDC) National Health and Nutrition Examination Survey (NHANES) is a program of studies designed to assess the health and nutritional status of adults and children in the United States. As part of the NHANES, the CDC monitors biomarkers of chemical exposure (chiefly metabolites) in the blood and urine to quantify the levels of chemical compounds present in U.S. residents. Each two-year study cycle comprises approximately 10,000 individuals, with exposure biomarker data for any given chemical available from only a subset of roughly 1/3 of the individuals in the study. In the 2014 publication “High Throughput Heuristics for Prioritizing Human Exposure to Environmental Chemicals” EPA scientists inferred steady state exposure rates (mg/kg bodyweight) for 106 chemicals from the NHANES urine samples.
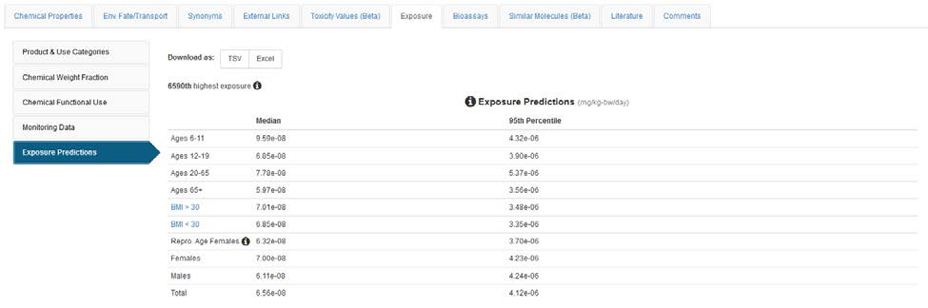
Predicted Exposure Data: The table of Exposure Predictions lists data produced as a result of the work published in Figure 4 of the 2014 publication “High Throughput Heuristics for Prioritizing Human Exposure to Environmental Chemicals” EPA scientists ranked 7968 chemicals based on the upper (highest) 95th percentile limit on the predicted average (geometric mean) exposure rate for the total U.S. population. This is one of those 7968 chemicals. The 1st highest would have the highest predicted possible rate, while the 7968th highest would have the lowest predicted possible rate. Note that because of limited information available on exposure to most chemicals the uncertainties are large and we are only 95% confident that the exposure rate is equal to or lower than the upper 95th percentile limit. The ranking for a chemical is shown on the top left hand side as the XXXXth Highest Exposure out of 7968 chemicals.