Collecting Snow and Ice Data
From “low-tech” backyard observations made by citizens in their own neighborhood to “high-tech” global satellite images of some of the most remote places in the world, scientists use a variety of techniques to track climate change. Below are some examples of the data collection methods used to create the indicators in this chapter.
Satellites
Satellites provide an efficient way to collect the kind of data that would be difficult to measure in person, such as measurements that need to be made at regular intervals over large areas or in remote locations. For example, the Arctic Sea Ice indicator is derived from data-rich images taken by satellites that orbit the Earth every day, using instruments that can tell the difference between sea ice and open water.
Field Measurements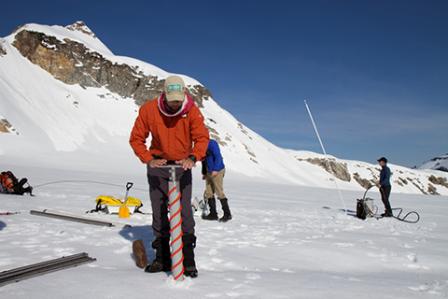
Sometimes going out in the field and measuring by hand is the best way to collect precise information and maintain a long-running dataset. For the Glaciers indicator, scientists visit the same glaciers twice a year at locations marked with a network of stakes, where they measure snow depth and density.
Citizen Science
You don’t need a Ph.D. to be a scientist. Many citizen scientists have helped to create high-quality datasets of climate indicators that date back further than some modern climate monitoring programs. The Lake Ice indicator includes local observations made from the same vantage point throughout the year. Some lakes have multiple observers, such as residents on both sides of a lake who can compare notes.
Observation Stations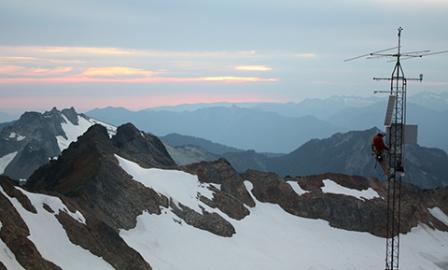
Automated observation stations make it possible to collect data continuously from places that may be difficult or expensive to reach. For example, scientists once had to travel to remote snowpack measurement sites by ski, snowshoe, snowmobile, or helicopter. Now, the Snowpack indicator uses hundreds of snow telemetry stations that automatically record and relay data back to a central computer every 15 minutes.