Climate Change Indicators: Weather and Climate
View Indicators:
A Closer Look:
Rising global average temperature is associated with widespread changes in weather patterns. Scientific studies indicate that extreme weather events such as heat waves and large storms are likely to become more frequent or more intense with human-induced climate change. This chapter focuses on observed changes in temperature, precipitation, storms, floods, and droughts.
Why does it matter?
Long-term changes in climate can directly or indirectly affect many aspects of society in potentially disruptive ways. For example, warmer average temperatures could increase air conditioning costs and affect the spread of diseases like Lyme disease, but could also improve conditions for growing some crops. More extreme variations in weather are also a threat to society. More frequent and intense extreme heat events can increase illnesses and deaths, especially among vulnerable populations, and damage some crops. While increased precipitation can replenish water supplies and support agriculture, intense storms can damage property, cause loss of life and population displacement, and temporarily disrupt essential services such as transportation, telecommunications, energy, and water supplies.
Summary of Key Points
- U.S. and Global Temperature. Average temperatures have risen across the contiguous 48 states since 1901, with an increased rate of warming over the past 30 years. Eight of the top 10 warmest years on record have occurred since 1998. Average global temperatures show a similar trend, and all of the top 10 warmest years on record worldwide have occurred since 1998. Within the United States, temperatures in parts of the North, the West, and Alaska have increased the most.
- High and Low Temperatures. Many extreme temperature conditions are becoming more common. Since the 1970s, unusually hot summer days (highs) have become more common over the last few decades in the United States. Unusually hot summer nights (lows) have become more common at an even faster rate. This trend indicates less “cooling off” at night. Although the United States has experienced many winters with unusually low temperatures, unusually cold winter temperatures have become less common—particularly very cold nights (lows). Record-setting daily high temperatures have become more common than record lows. The decade from 2000 to 2009 had twice as many record highs as record lows.
- U.S. and Global Precipitation. Total annual precipitation has increased over land areas in the United States and worldwide. Since 1901, precipitation has increased at an average rate of 0.08 inches per decade over land areas worldwide. However, shifting weather patterns have caused certain areas, such as the Southwest, to experience less precipitation than usual.
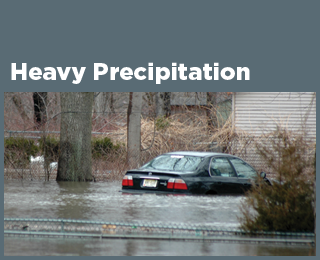
- Heavy Precipitation. In recent years, a higher percentage of precipitation in the United States has come in the form of intense single-day events. The prevalence of extreme single-day precipitation events remained fairly steady between 1910 and the 1980s but has risen substantially since then. Nationwide, nine of the top 10 years for extreme one-day precipitation events have occurred since 1990. The occurrence of abnormally high annual precipitation totals (as defined by the National Oceanic and Atmospheric Administration) has also increased.
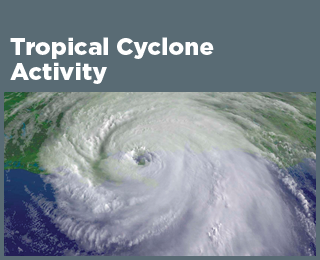
- Tropical Cyclone Activity. Tropical storm activity in the Atlantic Ocean, the Caribbean, and the Gulf of Mexico has increased during the past 20 years. Storm intensity is closely related to variations in sea surface temperature in the tropical Atlantic. However, changes in observation methods over time make it difficult to know for sure whether a longer-term increase in storm activity has occurred. Records collected since the late 1800s suggest that the actual number of hurricanes per year has not increased.
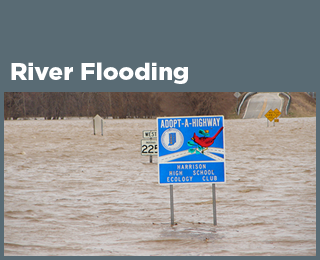
- River Flooding. Increases and decreases in the frequency and magnitude of river flood events vary by region. Floods have generally become larger across parts of the Northeast and Midwest and smaller in the West, southern Appalachia, and northern Michigan. Large floods have become more frequent across the Northeast, Pacific Northwest, and parts of the northern Great Plains, and less frequent in the Southwest and the Rockies.
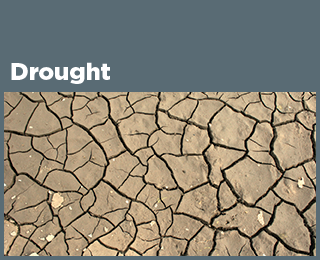
- Drought. Average drought conditions across the nation have varied since records began in 1895. The 1930s and 1950s saw the most widespread droughts, while the last 50 years have generally been wetter than average. However, specific trends vary by region. A more detailed index developed recently shows that over the period from 2000 through 2015, roughly 20 to 70 percent of the U.S. land area experienced conditions that were at least abnormally dry at any given time. However, this index has not been in use for long enough to compare with historical drought patterns.
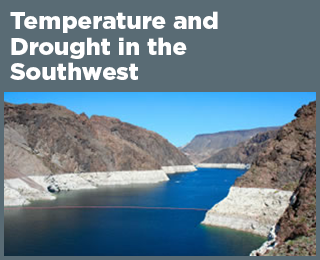
- A Closer Look: Temperature and Drought in the Southwest. The southwestern United States is particularly sensitive to changes in temperature and thus vulnerable to drought, as even a small decrease in water availability in this already arid region can stress natural systems and further threaten water supplies.