Climate Change Indicators: Snow and Ice
View Indicators:

Community Connection:
The Earth’s surface contains many forms of snow and ice, including sea, lake, and river ice; snow cover; glaciers, ice caps, and ice sheets; and frozen ground. Climate change can dramatically alter the Earth’s snow- and ice-covered areas because snow and ice can easily change between solid and liquid states in response to relatively minor changes in temperature. This chapter focuses on trends in snow, glaciers, and the freezing and thawing of oceans and lakes.
Why does it matter?
Reduced snowfall and less snow cover on the ground could diminish the beneficial insulating effects of snow for vegetation and wildlife, while also affecting water supplies, transportation, cultural practices, travel, and recreation for millions of people. For communities in Arctic regions, reduced sea ice could increase coastal erosion and exposure to storms, threatening homes and property, while thawing ground could damage roads and buildings and accelerate erosion. Conversely, reduced snow and ice could present commercial opportunities for others, including ice-free shipping lanes and increased access to natural resources.
Such changing climate conditions can have worldwide implications because snow and ice influence air temperatures, sea level, ocean currents, and storm patterns. For example, melting ice sheets on Greenland and Antarctica add fresh water to the ocean, increasing sea level and possibly changing ocean circulation that is driven by differences in temperature and salinity. Because of their light color, snow and ice also reflect more sunlight than open water or bare ground, so a reduction in snow cover and ice causes the Earth’s surface to absorb more energy from the sun and become warmer.
Summary of Key Points
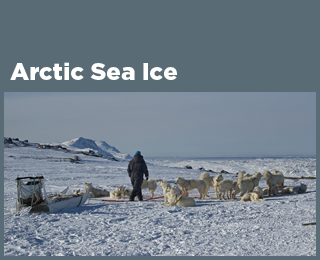
- Arctic Sea Ice. Part of the Arctic Ocean is covered by ice year-round. The area covered by ice is typically smallest in September, after the summer melting season. The annual minimum extent of Arctic sea ice has decreased over time, and in September 2012 it was the smallest ever recorded. The length of the melt season for Arctic ice has grown, and the ice has also become thinner, which makes it more vulnerable to further melting.
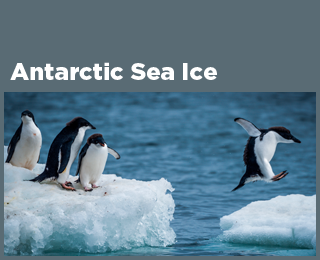
- Antarctic Sea Ice. Antarctic sea ice extent in September and February has increased somewhat over time. The September maximum extent reached the highest level on record in 2014—about 7 percent larger than the 1981–2010 average. Slight increases in Antarctic sea ice are outweighed by the loss of sea ice in the Arctic during the same time period, however.
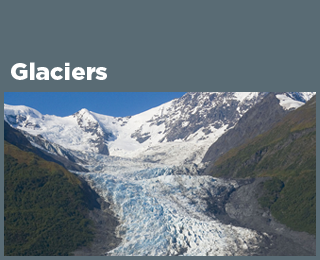
- Glaciers. Glaciers in the United States and around the world have generally shrunk since the 1960s, and the rate at which glaciers are melting has accelerated over the last decade. The loss of ice from glaciers has contributed to the observed rise in sea level.
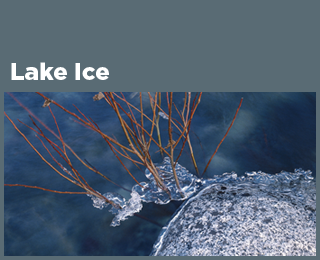
- Lake Ice. Lakes in the northern United States are freezing later and thawing earlier compared with the 1800s and early 1900s. Freeze dates have shifted later at a rate of roughly half a day to one-and-a-half days per decade. All of the lakes studied were also found to be thawing earlier in the year, with spring thaw dates growing earlier by up to 24 days in the past 110 years.
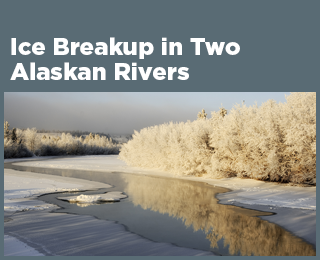
- Community Connection: Ice Breakup in Two Alaskan Rivers. Regions in the far north are warming more quickly than other parts of the world. Two long-running contests on the Tanana and Yukon rivers in Alaska—where people guess the date when the river ice will break up in the spring—provide a century’s worth of evidence revealing that the ice on these rivers is generally breaking up earlier in the spring than it once did.
- Snowfall. Total snowfall—the amount of snow that falls in a particular location—has decreased in most parts of the country since widespread records began in 1930. One reason for this decline is that nearly 80 percent of the locations studied have seen more winter precipitation fall in the form of rain instead of snow.
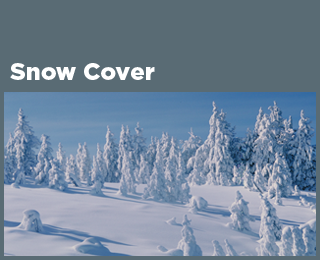
- Snow Cover. Snow cover refers to the area of land that is covered by snow at any given time. Between 1972 and 2015, the average portion of North America covered by snow decreased at a rate of about 3,300 square miles per year, based on weekly measurements taken throughout the year. There has been much year-to-year variability, however. The length of time when snow covers the ground has become shorter by nearly two weeks since 1972, on average.
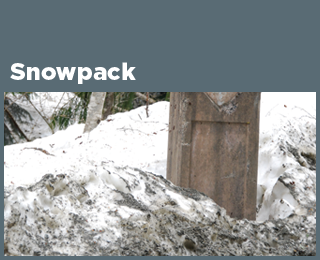
- Snowpack. The depth of snow on the ground (snowpack) in early spring decreased at more than 90 percent of measurement sites in the western United States between 1955 and 2016. Across all sites, snowpack depth declined by an average of 23 percent during this time period.