Climate Change Indicators: Stream Temperature
This indicator shows changes in stream water temperature across the Chesapeake Bay region.
-
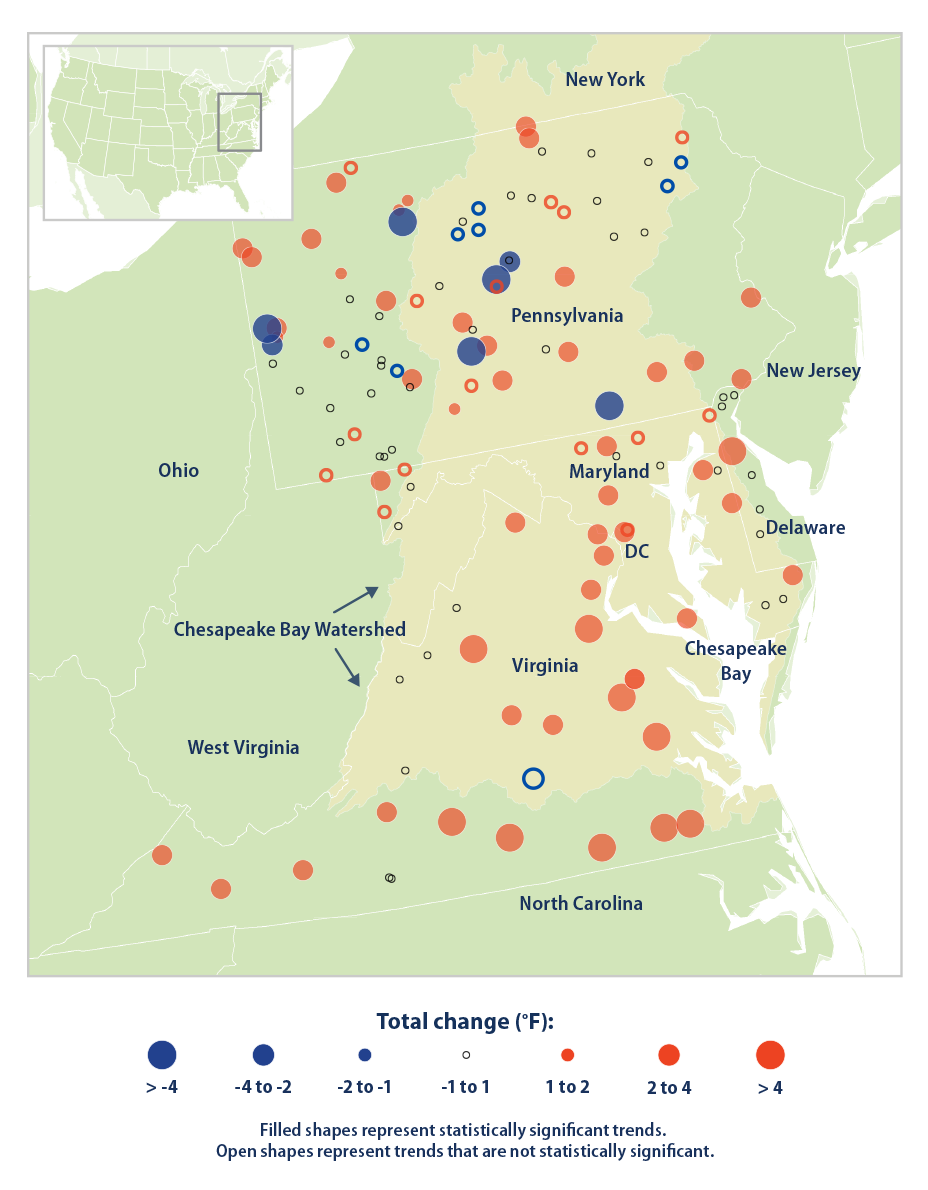
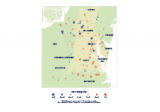
This map shows the change in water temperature at 129 stream gauges across the Chesapeake Bay region from 1960 to 2014. Red circles show locations where temperatures have increased; blue circles show locations where temperatures have decreased. Filled circles represent sites where the change was statistically significant.
Data source: Jastram and Rice, 20153
Web update: August 2016
Key Points
- From 1960 through 2014, water temperature increased at 79 percent of the stream sites measured in the Chesapeake Bay region (see Figure 1). More than half of these increases were statistically significant. Only 5 percent of stations had a significant temperature decrease over the same period.
- Since 1960, the Chesapeake Bay region has experienced an overall increase in stream water temperature. Temperature has risen by an average of 1.2°F across all sites and 2.2°F at the sites where trends were statistically significant.
- Stream temperatures have risen throughout the Chesapeake Bay region. The largest increases have occurred in the southern part of the region.
Background
Water temperature is an important physical property of every river and stream. Many plants, animals, and other organisms living in streams can flourish only in a specific range of water temperatures. Temperature can affect certain aspects of water quality. For example, higher temperatures reduce levels of dissolved oxygen in the water, which can negatively affect the growth and productivity of aquatic life. Persistently warmer temperatures in streams can accelerate natural chemical reactions and release excess nutrients into the water.1 A stream’s water temperature can also influence the circulation or mixing patterns in the water it flows into, like bays and estuaries, potentially affecting nutrient levels and salinity.
Temperatures can vary naturally along the length of a stream, from cold temperatures near a source of meltwater to higher temperatures near its outlet to the sea. The temperature at any given point is a product of many different factors, including sources of water (for example, melted snow, a recent rainstorm, or groundwater), the amount of water in the stream (streamflow), air temperature, plants along the bank (for example, trees that provide shade), and the amount of development within the watershed. Over time, however, an area’s climate has the strongest natural influence on a stream’s temperature.
The Chesapeake Bay is the largest estuary in the United States, an important habitat for countless aquatic species, and a driver of the regional economy. As rising air temperatures (see the U.S. and Global Temperature indicator) cause stream temperatures to rise, warmer stream water coming into the bay can stress plants and animals and worsen the effects of nutrient pollution that the bay is already facing.2
About the Indicator
The U.S. Geological Survey maintains thousands of stream gauges across the United States. Each gauge measures water levels several times a day, typically every 15 minutes. Field technicians visit each gauging station an average of eight times a year to measure various stream conditions, including water temperature. This indicator shows how average water temperatures throughout the year changed between 1960 and 2014 at 129 stream gauges located across the Chesapeake Bay region. These stations were selected because they had high-quality data for this entire time period.
About the Data
Indicator Notes
In addition to climate, changes to a stream’s average water temperature can be influenced by other factors such as industrial discharges, changes to local hydrology (such as construction and operation of dams and channels), and changes to land cover in the watershed. This indicator uses measurements from all stream gauges with sufficient data. Thus, it includes some stream sites that are likely more disturbed by human activities than others. A more detailed analysis of this data set found that water temperature tends to increase more quickly than air temperature in agricultural areas without major dams, but more slowly at forested sites and in areas influenced by dams.4 Nonetheless, a comparison of 35 relatively undisturbed reference stations with the remaining 94 stations in this indicator showed no significant difference in trends between the two groups of stations.5
This indicator is based on measurements that are collected an average of eight times per year, but more in some years and less in others. The data were analyzed in a way that accounts for variations in timing and makes it possible to compare average temperatures across many years.
Data Sources
This indicator is based on an analysis developed by the U.S. Geological Survey (USGS).6 Periodic temperature data were collected by the USGS, and these data are stored in the USGS National Water Information System.
Technical Documentation
References
1 Duan, S.W., and S.S. Kaushal. 2013. Warming increases carbon and nutrient fluxes from sediments in streams across land use. Biogeosciences 10:1193–1207.
2 Duan, S.W., and S.S. Kaushal. 2013. Warming increases carbon and nutrient fluxes from sediments in streams across land use. Biogeosciences 10:1193–1207.
3 Jastram, J.D., and K.C. Rice. 2015. Air- and stream-water-temperature trends in the Chesapeake Bay region, 1960–2014. U.S. Geological Survey Open-File Report 2015-1207. https://pubs.er.usgs.gov/publication/ofr20151207.
4 Rice, K.C., and J.D. Jastram. 2015. Rising air and stream-water temperatures in Chesapeake Bay region, USA. Climatic Change 128(1):127–138.
5 Jastram, J.D., and K.C. Rice. 2015. Air- and stream-water-temperature trends in the Chesapeake Bay region, 1960–2014. U.S. Geological Survey Open-File Report 2015-1207. https://pubs.er.usgs.gov/publication/ofr20151207.
6 Rice, K.C., and J.D. Jastram. 2015. Rising air and stream-water temperatures in Chesapeake Bay region, USA. Climatic Change 128(1):127–138.

