Research Highlights
EPA scientists have primary responsibility for the continual development of CMAQ and its related models. There are currently a number of research projects underway that focus on a range of topics, from exploration of atmospheric science fundamentals to incorporation and evaluation of recent scientific breakthroughs into research versions of the CMAQ model. Eventually, this new knowledge will serve the public by being incorporated in future publicly available CMAQ releases. The research and development team welcome comments and questions about these topics and would be happy to discuss the potential for collaborations.
Research Highlights: Table of Contents
- Using Near-Field Exposure Modeling to Inform Ambient Air Emissions and Models
- Photolysis of particulate nitrate oxidizes sulfur dioxide in the atmosphere
- EPA leads study synethesizing information on acididty of atmoshperic particles and clouds
- The Impact of LNOx Emissions on Ground-Level Ozone
- New Bidirectional Ammonia Flux Model
- Anthropogenic combustion emissions of NOx facilitate oxidation and resulting PM2.5 from biogenic monoterpenes
- Modeling long-term trends in nitrogen and sulfur deposition across the United States
- A Case Study Evaluation of Fog Simulation Using Two Land-Surface Models.
- Regional and Seasonal Lightning NOx and Implications to Ground-Level Air Pollution.
- Impacts of different characterizations of large-scale background on simulated regional-scale ozone
- Archive of past research highlights
Using Near-Field Exposure Modeling to Inform Ambient Air Emissions and Models
Researcher: Havala Pye
Posted: September 2020
Citation: Qin, M., Murphy, B.N., Isaacs, K.K., McDonald, B.C., Lu, Q., McKeen, S.A., Koval, L., Robinson, A.L., Efstathiou, C., Allen, C., Pye, H.O.T. Criteria pollutant impacts of volatile chemical products informed by near-field modeling. Nat Sustain (2020). https://doi.org/10.1038/s41893-020-00614-1
Read only link: https://rdcu.be/b76hV
 Summary: Understanding the role of volatile chemical products (VCPs, see emerging applications of CMAQ) on air quality and health requires information on product usage, the fraction of product emitted to air, and the reaction pathways that result in ozone and secondary organic aerosol (SOA). In recent work by Qin et al., the High-Throughput Stochastic Human Exposure and Dose Simulation (SHEDS-HT) model was used to estimate product usage and the emissions of VOCs while the CMAQ model along with observational constraints from the CalNex field campaign were used to bound the role of VCPs in ozone and SOA formation. SHEDS-HT, literature, and top-down constraints imposed by ambient observations suggest that emissions of VOCs from VCPs are likely underestimated in the NEI for California and potentially across the United States. After remedying emission magnitudes and SOA formation potential, CMAQ indicates VCPs are responsible for ~41% of fresh SOA and ~17% of maximum daily 8-hr average ozone in summer Los Angeles. Inhalation was also estimated to be more competitive with dermal and ingestion exposure to organic compounds than previously thought.
Photolysis of Particulate Nitrate Oxidizes Sulfur Dioxide in the Atmosphere
Researcher: Golam Sarwar
Posted: August 2020
Citation: Zheng, H., Song, S., Sarwar, G., Gen, M., Wang, S., Ding, D., Chang, X., Zhang, S., Xing, J., Sun, Y., Ji, D., Chan, C. K., Gao, J., McElroy, M. B.: Contribution of particulate nitrate photolysis to heterogeneous sulfate formation for winter haze in China, Environ. Sci. Technol. Lett. 2020, publication Date: June 25, 2020, https://doi.org/10.1021/acs.estlett.0c00368
 Enahncement of sulfate concentration at a particulate nitrate photolysis reate of 100 x the nitric acid photolysis rate. Note that the scale is not linear. Summary: Recent experimental studies suggest that particulate nitrate can photolyze and produce nitrous acid in aerosol liquid water which can subsequently oxidize sulfur dioxide into sulfate. In this study, we implemented a heterogeneous reaction in the Community Multiscale Air Quality (CMAQ) model to represent the conversion of sulfur dioxide into sulfate due to the photolysis of particulate nitrate and examined its impact on sulfate production in China. The current model without the chemistry substantially under-predicts observed atmospheric sulfate concentrations in China. Model results suggest that the reaction can increase sulfate production in China and the enhancement depends on the particulate nitrate photolysis rate used in the analysis. Reported photolysis rate of particulate nitrate vary by 1-3 orders of magnitude. The reaction can increase sulfate concentration by ~15% of the gap between the model prediction and observed concentration in winter when a particulate nitrate photolysis rate of 10 x the nitric acid photolysis rate is used. However, it increases sulfate concentration by ~65% of the gap between the model and observed concentration at a particulate nitrate photolysis rate of 100 x the nitric acid photolysis rate. Additional research is currently underway to examine the impact of the reaction on sulfate production over the Northern Hemisphere.
EPA Leads Study Synthesizing Information on Acidity of Atmospheric Particles and Clouds
Researcher: Havala Pye
Posted: May 2020
Citation: Pye, H. O. T., Nenes, A., Alexander, B., Ault, A. P., Barth, M. C., Clegg, S. L., Collett Jr., J. L., Fahey, K. M., Hennigan, C. J., Herrmann, H., Kanakidou, M., Kelly, J. T., Ku, I.-T., McNeill, V. F., Riemer, N., Schaefer, T., Shi, G., Tilgner, A., Walker, J. T., Wang, T., Weber, R., Xing, J., Zaveri, R. A., and Zuend, A.: The acidity of atmospheric particles and clouds, Atmos. Chem. Phys., 20, 4809–4888, https://doi.org/10.5194/acp-20-4809-2020, 2020.

Summary: The acidity of atmospheric condensed phases, particles and clouds, has implications for particulate matter formation, deposition, and metal solubilization. Historical measurements indicate that cloud and fog droplet acidity has changed in recent decades in response to controls on emissions from human activity, while the limited trend data for suspended particles indicate acidity may be relatively constant. A new review by Pye et al. in Atmospheric Chemistry and Physics reflects the efforts of an international team to synthesize knowledge on the acidity of atmospheric particles and clouds. It includes recommendations for estimating acidity and pH, standard nomenclature, a synthesis of current pH estimates based on observations, and new model calculations on the local and global scale.
As part of the activity, CMAQ as well as other models’ fine aerosol pHF (figure below) and cloudwater pHF values were presented. Since cloud and aerosol pH are an important property influencing a wide range of endpoints, improvements to how aerosol and cloud pH are represented in models could potentially enhance policy and programs informed by them. For locations with observationally constrained pH estimates, agreement between models and observations can be within 1 pH unit. However, the acceptable level of agreement required between models and observations depends on the target of a specific assessment (e.g., PM sensitivity to emissions, deposition of nutrients and acidity, metal solubility). Evaluating a model’s pH in the context of how an error in pH may propagate to an endpoint of interest could help uncover model biases that have been unidentified to date and increase the understanding of the effects of emissions, human activity, and climate change on society and the Earth system as a whole.
The article is included in the Encyclopedia of Geosciences, a collection of peer-reviewed scientific review articles on topics relevant to the geosciences, published in the open-access journals of the European Geosciences Union (EGU).
 Particle pHF at the surface predicted by (a) CMAQv5.2 for Aitken + accumulation modes, (b) GEOS-Chem for bulk fine aerosol, (c) TM4-ECPL for PM1, and (d) TM4-ECPL for coarse aerosol.
EPA Study Shows Significant Ground-Level Ozone in the U.S. Mountain West Attributed to Lightning-Induced Nitrogen Oxide Emissions
Researcher: Daiwen Kang
Posted February 2020
Citation: Kang, D., R. Mathur, G. A. Pouliot, R. C. Gilliam, and D. C. Wong, 2020: Significant ground-level ozone attributed to lightning-induced nitrogen oxides during summertime over the Mountain West States. npj Climate and Atmospheric Science, 3, doi:10.1038/s41612-020-0108-2.
Summary: Stringent National Ambient Air Quality Standards are required to protect susceptible populations and improve public health. Accordingly, effective control measures on man-made contributions to air pollution must consider natural sources and their contributions to background pollution levels. Lightning-induced nitrogen oxides (LNOX) in the presence of sunlight, volatile organic compounds, and water vapor can be a relatively large but uncertain source of ozone (O3). Using lightning flash data to estimate LNOX emissions in the Community Multiscale Air Quality (CMAQ) model, EPA scientists demonstrated that typical summertime lightning activity across the U.S. Mountain West injects NOX emissions comparable to those from man-made sources over the region, contributing significantly to the amount of ground-level O3 in that region. This study was recently published in the Nature Partner Journal Climate and Atmospheric Science and highlights the growing need for comprehensive models, such as CMAQ, to quantify natural sources and their contributions to background O3.
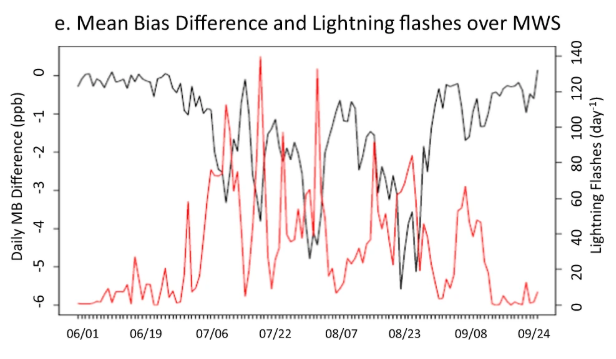 Time series of the mean bias difference between the two simulations and the daily mean lightning flashes.
New Bidirectional Ammonia Flux Model in an Air Quality Model Coupled with an Agricultural Model
Researcher: Jonathan Pleim
Posted October 2019
Citation: Pleim, J. E., Ran, L., Appel, W., Shephard, M. W., & Cady‐Pereira, K. (2019). New bidirectional ammonia flux model in an air quality model coupled with an agricultural model. Journal of Advances in Modeling Earth Systems, 11. https://doi.org/10.1029/2019MS001728
Summary: Ammonia surface flux is bidirectional; that is, net flux can be either upward or downward. In fertilized agricultural croplands and grasslands there is usually more emission than deposition especially in midday during warmer seasons. In North America, most of the ammonia emissions are from agriculture with a significant fraction of that coming from fertilizer. In this study we developed a new bidirectional ammonia flux modeling system that has been implemented in the Community Multiscale Air Quality (CMAQ) model version 5.3, which has close linkages with the Environmental Policy Integrated Climate (EPIC) agricultural ecosystem model. Daily inputs from EPIC are used to calculate soil ammonia concentrations that are combined with air concentrations in CMAQ to calculate bidirectional surface flux. The model is evaluated against surface measurements of NH3 concentrations, NH4+ and SO42− aerosol concentrations, NH4+ wet deposition measurements, and satellite retrievals of NH3 concentrations. The evaluation shows significant improvement over the base model without bidirectional ammonia flux. Comparisons to monthly average satellite retrievals show similar spatial distribution with the highest ammonia concentrations in the Central Valley of California (CA), the Snake River valley in Idaho, and the western High Plains. In most areas the model underestimates, but in the Central Valley of CA, it generally overestimates ammonia concentration. Case study analyses indicate that modeled high fluxes of ammonia in CA are often caused by anomalous high soil ammonia loading from EPIC for particular crop types. While further improvements to parameterizations in EPIC and CMAQ are recommended, this system is a significant advance over previous ammonia bidirectional surface flux models.

Ammonia concentration from CMAQ on left and CrIS satellite retreivals on right averaged for June 2016
Anthropogenic combustion emissions of NOx facilitate oxidation and resulting PM2.5 from biogenic monoterpenes
Researcher: Havala Pye
Posted: March 2019
Citation: Pye, H. O. T., D’Ambro, E., Lee, B., Schobesberger, S., Takeuchi, M., Zhao, Y., Lopez-Hilfiker, F., Liu, J., Shilling, J., Xing, J., Mathur, R., Middlebrook, A., Liao, J., Welti,A., Graus, M., Warneke, C., de Gouw, J., Holloway, J., Ryerson, T., Pollack, I., Thornton, J. A.: Anthropogenic enhancements to production of highly oxygenated molecules from autoxidation. P Natl Acad Sci USA, https://doi.org/10.1073/pnas.1810774116, 2019.
Summary: Recent work by Pye et al. (2019) shows that autoxidation pathways dictate the abundance and anthropogenic modulation of secondary organic aerosol (SOA) from monoterpenes. A key feature of the mechanistic SOA developed in the work is the low volatility of the particles, making them relatively insensitive to changes in primary organic aerosol or other organic aerosol sources via absorptive partitioning feedbacks. While reductions in NOx are predicted to lead to increasing autoxidation and potential for PM2.5, they also reduce oxidant abundance which can offset the changes in SOA yield such that NOx emission reductions have co-benefits for monoterpene SOA from first generation autoxidation pathways. Evidence for the mechanism was observed downwind of Atlanta in the summer of 2013 where autoxidation products were enhanced in the presence of elevated NO. The mechanism developed by Pye et al. indicates that about a quarter of the recent (1990-2010) decline in organic aerosol in the southeast US may be due to changes in monoterpene SOA.
 NOx emissions from urban centers mix with emissions from vegetation facilitating PM2.5 formation in many parts of the world including downwind of Atlanta, Georgia pictured here.
Read more about monoterpene SOA development in CMAQ: Improving the representation of monoterpene chemistry leading to PM2.5 in CMAQ
Modeling long-term trends in nitrogen and sulfur deposition across the United States
Researcher: Rohit Mather
Posted: September 2018
Citation: Zhang, Y., Mathur, R., Bash, J. O., Hogrefe, C., Xing, J., and Roselle, S. J.: Long-term trends in total inorganic nitrogen and sulfur deposition in the US from 1990 to 2010, Atmos. Chem. Phys., 18, 9091-9106, https://doi.org/10.5194/acp-18-9091-2018 , 2018.
Summary: The ultimate-fate of atmospheric emissions of NOx, NH3 and SO2 and their derived products is removal by wet scavenging and dry deposition at the surface. Accurate quantification of these atmospheric sinks of airborne nitrogen and sulfur species is important not only from an atmospheric budget perspective, but also because of potential ecological effects arising from their deposition to terrestrial and aquatic ecosystems. Excess deposition of nitrogen and sulfur is detrimental to ecosystems, since it leads to decreased biological diversity, increased terrestrial and aquatic eutrophication and acidification. Accurate quantification of changes in atmospheric deposition amounts is critical for maintaining ecosystem health.
In this study, we use model simulations spanning a 21-year period from 1990-2010 to investigate the spatial distribution and temporal trends in the total inorganic nitrogen and total sulfur deposition across the U.S., including changes in chemical composition of the deposition as well as the relative importance of the wet and dry deposition components. Analysis indicate that atmospheric deposition amounts of both total inorganic nitrogen and sulfur have decreased significantly across the U.S. in response to reductions in emissions of NOx and SO2. Total inorganic nitrogen deposition decreased significantly over the Eastern Temperate Forests, Northern Forests, Mediterranean California and Marine West Coast Forest, resulting from decrease in oxidized nitrogen deposition driven by reductions in NOx emissions during this period. Nationwide, dry deposition accounted for 58-65% inorganic nitrogen deposition amount. Oxidized nitrogen dominated the total inorganic nitrogen deposition in the U.S. during the first decade but a shift occurred in 2003 when deposition of reduced nitrogen became dominant. The study highlights the growing importance of NHX deposition as emissions of NOX and SO2 have been reduced substantially over the years.
 Spatial distribution of the trends in total (a) oxidized nitrogen deposition (TNO3), and (b) reduced nitrogen deposition (NHX) from 1990 to 2010. Grey areas on the both plots show p value great than 0.05 for the standard two-tailed Student t-test (i.e. areas where trend estimates were not significant at the 95% confidence level).
A Case Study Evaluation of Fog Simulation Using Two Land-Surface Models
Researcher: Brian Eder
Posted: August 2018
Citation: Brian Eder, Robert Gilliam, Patrick Campbell, Melissa Wrzesien , Donna Schwede and Tanya Spero, presented at the Joint WRF and MPAS Users' Workshop, Boulder, Colorado, June 11th – 15th, 2018.
Summary: Despite its importance to ecosystem health (related to pollutant and nutrient deposition), the numerical simulation of fog lags the simulation of other meteorological phenomena due, in large part, to its complexity and limitations of model resolution.
This evaluation provides a case study of fog formation/simulation in the Nooksack Valley Region centered in Washington State during an extensive fog episode in January of 2014. Numerous simulations of WRFV3.9 (4 km) were conducted using two land-surface models: PX-LSM and Noah-LSM and a variety of physics parameterizations. Two such configurations designed to provide commensurability were examined in this study focusing on a 72-hour period 00UTC 19 January – 23UTC 21 January.
A snapshot in time (19UTC 19 January) is shown below comparing a GOES (West) 1 km visible satellite image with the total liquid water content (g/kg) of the lowest 8 model layers for the PX-LSM (middle) and the Noah-LSM (right). Colorization starts at a threshold of ≥ 0.015 g/kg which corresponds to visibilities less than 1000 m, the threshold for fog as defined by the World Meteorological Society. Both LSMs simulated advection fog well (seen over the Pacific Ocean), but tend to under simulate radiation fog over the Nooksack Valley in the eastern part of the State. This underestimation, which was more prevalent with the Noah-LSM, is being investigated.

Regional and Seasonal Lightning NOx and Implications to Ground-Level Air Pollution
Researcher: Daiwen Kang
Posted: July 2018
Citation: Daiwen Kang, Rohit Mathur, Limei Ran, Gorge Pouliot, David Wong, Kristen Foley, Wyat Appel, and Shawn Roselle, presented at 36th ITM on Air Pollution Modeling and its Application, Ottawa, Canada, May 14th – 18th, 2018
Summary: As one of the largest sources of natural NOX, it is estimated that lightning-induced NOX (LNOX) contributes 10-15% of the total global NOX emissions budget. Lightning activity exhibits strong spatial and temporal variations, and consequently so does the tropospheric distribution of NOX from lightning flashes. To accurately assess the impact of LNOX on air quality, the LNOX contributions to the total NOX emissions needs to be quantified in space and time, which entails robust LNOX production and distribution schemes in air quality models. In the current version (v5.2) of the Community Multiscale Air Quality (CMAQ) model, for retrospective model simulations, we have implemented a LNOX production scheme based on hourly gridded lightning flashes from the National Lightning Detection Network (NLDN) to estimate gridded hourly total LNOX across the contiguous US. After the column total LNOX is calculated, it is distributed vertically through the model layers based on the double-peak algorithm described in Allen et al. (2012; https://doi.org/10.5194/acp-12-1737-2012).
Using the 2011 National Emissions Inventory (NEI) for anthropogenic NOx emissions and soil NO emissions estimated using CMAQ inline biogenic emission, we quantified the relative contributions of LNOx to the total NOx emissions budget in time and space for April to September 2011 over the contiguous United States. Model simulations with and without LNOx were performed to assess the impact of LNOx on ground-level air quality by region and month. The major findings from this research are:
- The contribution of LNOX emissions to the total NOX emissions ranges from 10% (September) to 22% (July) over the contiguous US.
- Averaged over the six-month period (April - September), Southeast (SE, see the map in Figure 1) has the largest LNOX ratios (20%) followed by Rocky Mountain (RM) area (16%).
 Figure 1. (a) Regions, (b) The monthly ratio of LNOX to the total NOX emissions over the domain and each of the regions as shown in (a)
- During July and August, the largest LNOX ratios are observed for the RM region (30% and 28%, respectively).
- The CMAQ simulation for summer 2011 shows that the addition of LNOx emissions reduces the daily CMAQ low bias for daily maximum 8-hr O3 by as much as 5 ppbv in the RM region.
 Figure 2. Overlay of the measured O3 by aircraft (P3B) during the DISCOVER-AQ campaign on July 28, 2011. On the left is the model simulation without LNOx (Base) and the right is the model simulation with LNOx (NLDN). Compared to the Base case, O3 levels in NLDN case increase aloft to reduce the under-prediction and decrease near the surface to alleviate the over-prediction.
Impacts of Different Characterizations of Large-Scale Background on Simulated Regional-Scale Ozone
Researcher: Christian Hogrefe
Posted: June 2018
Citation: Hogrefe, C., P. Liu, G. Pouliot, R. Mathur, S. Roselle, J. Flemming, M. Lin, AND R. Park. Impacts of different characterizations of large-scale background on simulated regional-scale ozone over the continental United States. Atmospheric Chemistry and Physics. Copernicus Publications, Katlenburg-Lindau, Germany, 18:3839-3864, (2018). https://doi.org/10.5194/acp-18-3839-2018 Exit
Summary: As the ozone National Ambient Air Quality Standard (NAAQS) has tightened, non-attainment areas continue to exist in a number of U.S. regions. To design efficient and effective NAAQS attainment strategies, it is important to accurately quantify the contributions of local vs. background sources (such as trans-Pacific transport of air pollution) to non-attainment. Doing so requires evaluating and advancing our modeling techniques for representing ozone fluctuations on regional-to-hemispheric scales which in turn necessitates a detailed understanding of the relevant processes (vertical mixing in source and receptor regions, multi-day transport and chemistry in the free troposphere, and stratosphere/troposphere exchange processes) and how they are represented in current-generation global and regional-scale modeling tools.
This recent study analyzed CMAQ-modeled ozone burdens over the U.S. both near the surface and aloft, estimated the contributions of different physical and chemical processes to these burdens, and calculated the sensitivity of the simulated regional-scale ozone burden to large-scale background ozone as specified by lateral boundary conditions derived from different hemispheric or global scale models using a consistent set of anthropogenic emission inputs. The analysis of these regional-scale CMAQ simulations highlighted that differences in ozone boundary conditions resulted in differences of CMAQ-simulated ozone column mass for different vertical layer ranges across the entire modeling domain. In particular, the results strongly suggest that differences in the mid-tropospheric ozone mixing ratios simulated by the large-scale models were the main driver of ozone differences between the corresponding regional-scale CMAQ simulations.
 Monthly average time series of 500 hPa observed ozone, ozone simulated by large-scale models (solid lines), and ozone simulated by regional CMAQ driven with boundary conditions from different large-scale models (dashed lines) at the Trinidad Head, Edmonton, Boulder, Huntsville, and Wallops Island ozonesonde sites. These time series show the close relationship between free tropospheric ozone simulated by regional CMAQ and the global model providing the lateral boundary conditions.Vertical mixing, including mixing by convective clouds, couple the fluctuations in free tropospheric ozone to ozone in lower layers. Analysis of ozone mixing ratios at the surface confirmed that the characterization of ozone outside the regional-scale modeling domain can have a profound impact on CMAQ-simulated ground-level ozone and can affect the comparison of these simulations with available observations.
The study was published as part of a special issue on “Global and regional assessment of intercontinental transport of air pollution: results from HTAP, AQMEII and MICS” in the journal Atmospheric Chemistry and Physics.
 Time series of differences between CMAQ-simulated and observed daily maximum 8-hr surface ozone mixing ratios at AQS monitors. Four different CMAQ simulations are displayed. For the “BASE” configuration, lateral boundary conditions were obtained from the C-IFS global model. For the three sensitivity simulations, lateral boundary conditions were obtained from hemispheric CMAQ, GEOS-Chem, and AM3. This figure illustrates the impact of lateral boundary conditions on surface ozone simulated by CMAQ, especially outside the summer season.