eGRID Questions and Answers
- What is eGRID?
- Why eGRID?
- What information is contained in eGRID?
- Who uses eGRID?
- What years are available for eGRID?
- What has changed in recent years?
- What is new in eGRID2018?
- Are EIA-923 data updates reflected in eGRID?
- What is Grid Gross Loss (GGL)?
- How has the methodology for assigning plants to eGRID subregions changed?
- How has the methodology for estimating methane (CH4) emissions changed?
- Did the eGRID naming convention change?
- Is there additional eGRID data available?
- What do the eGRID subregion and NERC region maps look like?
- How has the subregion map changed?
- What are the regional emission rates and resource mix?
- How can I receive eGRID related news from EPA?
- What other emissions data are available from EPA?
- Why are there outliers for some output emission rates?
- Why are there differences at a small number of plants between total net generation and generation by fuel type?
- What other EPA tools are available to estimate avoided emissions from EE/RE programs?
- How can I provide feedback or ask questions?
What is eGRID?
The Emissions & Generation Resource Integrated Database (eGRID) is a comprehensive inventory of environmental attributes of electric power systems. The preeminent source of air emission data for the electric power sector, eGRID is based on available plant-specific data for all U.S. electricity generating plants that provide power to the electric grid and report data to the U.S. government. eGRID uses data from the Energy Information Administration (EIA) Forms EIA-860 and EIA-923 and EPA’s Clean Air Markets Program Data. Emission data from EPA are carefully integrated with generation data from EIA to produce useful values like pounds of emissions per megawatt-hour of electricity generation (lb/MWh), which allows direct comparison of the environmental attributes of electricity generation. eGRID also provides aggregated data by state, U.S. total, and by three different sets of electric grid boundaries (i.e., balancing authority area, NERC region, and eGRID subregion).
Why eGRID?
Many consumers have a choice regarding the source of their electricity, and some seek cleaner sources, such as wind and solar power. EPA’s Power Profiler application, which uses eGRID data, helps individual consumers understand the environmental impacts of their own electricity usage.
Electricity generation is the dominant industrial source of air emissions in the United States today. Whenever you switch on an electrical appliance, chances are you are contributing to air pollution and greenhouse gas emissions. By documenting the environmental attributes of electric power generation, eGRID can help consumers and researchers to better understand the relationship between electricity and the environment.
In the United States, electricity is generated in many different ways, with a wide variation in environmental impacts. In many states, power companies are required to disclose the environmental attributes of their retail electricity products. eGRID data can be used to support the following activities:
- Greenhouse gas registries and inventories,
- Carbon footprinting,
- Consumer information disclosure,
- Renewable portfolio standards,
- Development of emission inventories and emission standards,
- Analysis of changing power markets, and
- Estimation of avoided emissions.
What information is contained in eGRID?
For every power plant in the United States, eGRID provides:
- A detailed emissions profile, covering nitrogen oxides (NOX), sulfur dioxide (SO2), carbon dioxide (CO2), methane (CH4), nitrous oxide (N2O), and mercury (Hg). (Hg emissions are available prior to year 2007). Mass emissions are reported in either pounds or tons. Output emission rates are reported pounds per megawatt-hour (lb/MWh) and input emission rates are reported in pounds per million British thermal units (lb/MMBtu);
- Generation resource mix, in megawatt-hours and percent; and
- Identification and location information.
eGRID provides separate data at the unit and generator levels. These data are combined at the plant level. The plant level data are then aggregated to state, U.S. total, and three types of power grid regions:
- Balancing authority area (generally smaller regions of the power grid in which all power plants are managed to balance power system demand and supply);
- eGRID subregion; and
- NERC region, as designated by the North American Electric Reliability Corporation (plus Alaska and Hawaii).
The eGRID historical ZIP file currently contains the data and supplementary files (e.g., technical support documents, maps, summary tables, and release notes) for years 1996, 1997, 1998, 1999, 2000, 2004, 2005, 2007, 2009, 2010, 2012, 2014, and 2016. Net imports-exports by state are provided for years 2004, 2005, and 2007. Data on net imports-exports by state and power interchange between grid regions are included in eGRID data for years 1996 through 2000. The eGRID2018 ZIP file contains year 2018 data and supplementary files.
Who uses eGRID?
eGRID is valuable to those in the Federal Government, state and local governments, non-governmental organizations, companies, and academia. It is also useful to individuals seeking environmental information about the electric power sector in the United States. eGRID is most often used to estimate indirect emissions from electricity purchases, in GHG inventories, for carbon footprinting, and for estimating avoided emissions from programs and projects that reduce consumption of grid-supplied electricity. eGRID data are cited by many emission inventory and registry protocols, various emission calculation tools and applications, hundreds of academic papers, and consultants; it is used for many research applications and efforts.
Within EPA, eGRID data are used by the following applications and programs: Power Profiler, Center for Corporate Climate Leadership, Portfolio Manager, the Household Greenhouse Gas Emissions Calculator, and the Greenhouse Gas Equivalencies Calculator.
When EPA announced the winners of its 2011 “Apps for the Environment” challenge, two winning apps — Light Bulb Finder Exit and Joulebug Exitused eGRID data.
In 2015, Executive Order 13693 was issued, requiring Federal agencies to reduce their greenhouse gas emissions from direct and indirect activities. The order requires that Federal agencies report their building information in EPA’s Portfolio Manager which uses eGRID to estimate emission reductions.
Fueleconomy.gov, a partnership between EPA and DOE, uses eGRID data to estimate the total GHG emissions from electric and plug-in hybrid vehicles in its Greenhouse Gas Emissions for Electric and Plug-in Hybrid Electric Vehicles calculator.
eGRID is also used by other Federal Government agencies such as Oak Ridge National Laboratory (ORNL) for their Combined Heat and Power and Emissions Savings Calculator, the National Energy Technology Laboratory (NETL) for their sponsored Distributed National Carbon Sequestration Database and Geographic Information System (NATCARB), and the National Renewable Energy Laboratory (NREL) for their micropower distributed generation optimization model named HOMER.
One of the most popular recent uses of eGRID is to determine the indirect GHG emissions from electricity purchases and avoided GHG emissions from projects and programs that reduce the demand for grid supplied electricity. For example, the California Air Resources Board, Climate Registry, Climate Action Reserve, and Greenhouse Gas Protocol cite eGRID for use in estimating scope-2 GHG emissions from electricity purchases in the United States. Most carbon footprint calculators that are applicable to the United States use eGRID data.
States and local governments rely on eGRID data for electricity labeling (environmental disclosure programs), emission inventories, and registries as well as for efforts to analyze air emissions from the electric power sector. Several states have used eGRID to publish state specific emission information or have used eGRID to inform policy decisions.
Renewable energy certificates (RECS) tracking systems, such as ISO-New England’s Generation Information System (GIS) and PJM Interconnection’s Generation Attribute Tracking System (GATS), use eGRID data.
eGRID is used by many nongovernmental organizations in their tools and analysis. One example is Carbon Footprint Visualizations Exitby Carbon Visuals, which illustrates accurate volumetric images to visualize the carbon footprint of all U.S. power stations. Another example is The University of California, Berkeley’s CoolClimate Carbon Footprint Maps. Exit
What years are available for eGRID?
The latest version of eGRID (eGRID2018) was the thirteenth edition released in January of 2020 with data from 2018. The data are available on the eGRID website as individual files or as a single eGRID2018 ZIP file. eGRID data for the years 1996 thru 2000, 2004, 2005, 2007, 2009, 2010, 2012, 2014, and 2016 are available in the eGRID historical ZIP file.
What has changed in recent years?
In recent years, there have been several changes to the eGRID content, methodology, and presentation of data. The significant changes starting with the release of eGRID2012 include:
eGRID2012
- Included entire universe of plants and associated generators, including plants with zero generation, which had been excluded from previous editions of eGRID.
- The national-fuel and state-fuel content average, calculated from EIA-923 Schedule 3A, was updated.
- Color coded cross-hatching was added to the subregion map in order to illustrate areas where there are secondary and tertiary service subregions.
- Subregion shapefiles were provided.
- The naming convention changed to include the data year in the title (e.g. “eGRID2012” includes data for 2012); previous naming conventions listed the year eGRID was released rather than the year of the data used.
eGRID2014
- Replaced “Boiler” file with new “Unit” file; included the entire universe of units; not just the subset of boilers with unit-level data from EPA/CAMD or EIA.
- Revised the plant-to-eGRID subregion assignment methodology to be based on where the plant is located rather than where it supplies its electricity (revised again in eGRID2016).
- Revised the grid gross loss methodology to use only data from the EIA State Electricity Profiles, rather than a mix of data from EIA and the Federal Energy Regulatory Commission (FERC).
- Modified the CHP adjustment methodology.
- Updated the methodology to determine generation and NOx emissions in the ozone season.
- Added unadjusted heat input for renewable fuels (which is calculated by EIA) to the Plant file.
- Added non-baseload generation by fuel type and non-baseload resource mix to the subregion file.
- Added CH4 and N2O emission rates by fuel type to the eGRID Subregion file.
- Moved supplemental data such as historical sequence IDs to another spreadsheet.
- Renamed Power Control Area file to Balancing Authority file to reflect the terminology currently used by the EIA and NERC.
- Provided a metric unit version of the data file.
- EIA data were allocated to unit level allowing the unit level data sum to equal the plant-level data.
- Added a hyperlinked table of contents and color coding to the data file.
- Identified data sources at a more granular level.
- CH4 emissions factors for coal changed.
- Revised the CHP adjustment calculations to no longer estimate a CHP adjustment ratio for plants where EIA reports the heat input for electricity generation as equal to the total heat input for the plant.
eGRID2016
- Revised the plant-to-eGRID subregion assignment methodology to be based on where the plant supplies its electricity, rather than where the plant is physically located. This change returns the methodology to the approach used in eGRID2012 and previous editions.
- Reported CH4 and N2O output and input emission rates in lb/MWh and lb/MMBtu, rather than lb/GWh and lb/BBtu.
More information about each of these changes can be found in the “What’s New” sections of the Technical Support Documents (TSD) available with each eGRID release. All historical TSDs are available in the eGRID historical ZIP file.
What is new in eGRID2018?
eGRID2018 was originally released on January 28, 2020 and the revised version, eGRID2018v2, was released on March 9, 2020. The CH4 and N2O input emission rates (lb/MMBtu) and fuel-specific output emission rates (lb/MWh) were corrected in v2. The original 2018 eGRID version mistakenly applied a tons-to-pounds conversion factor of 2,000 to these specific CH4 and N2O rates. The following columns in the eGRID2018 Data file (XLSX) were changed: BJ & BK on the PLNT18 sheet; AE & AF and BF through BM on the ST18, BA18, SRL18, and NRL18 sheets; and AC & AD and BD through BK on the US18 sheet. No other data changes were made and the summary tables remain the same.
eGRID2018 is updated with 2018 data and includes the following new data elements and changes to the methodology:
- Mercury emissions (when available) are included at the unit-level.
- Global warming potential (GWP) values are updated to the Fourth IPCC Assessment values.
- Heat input and emissions values used to adjust combined heat and power (CHP) plants and biomass plants are added to the plant-level.
- Plant-level sector information is added.
- The number of boilers at the plant-level is changed to number of units.
- The "Plant operator name" field is changed to "Plant transmission or distribution system owner name" and the "Utility service territory name" field is changed to "Utility name".
- CH4 and N2O emission factors for refined coal (RC) and waste coal (WC) are updated.
- The emission factor for NOX emissions from flaring of landfill gas (LFG) used in the biomass adjustment of LFG is updated.
- Fuel specific nonbaseload generation is added to the State, BA, NERC region, and US levels.
- Input emission rates (lb/MMBtu) for CH4, N2O, and CO2e are added to the Plant, State, BA, eGRID subregion, NERC region, and US levels (revised in v2).
- Fuel specific output emission rates (lb/MWh) for CH4, N2O, and CO2e are added to the State, BA, eGRID subregion, NERC region, and US levels (revised in v2).
- The grid gross loss (GGL) methodology changed, now excludes exports.
Please see the Technical Support Document for more details. Because there are some methodological changes in different editions of eGRID from year to year, please use caution when comparing data from different years.
Are the EIA-923 data updates reflected in eGRID?
The 2018 EIA-923 data were originally released on September 20, 2019. Subsequently, the Energy Information Administration (EIA) released several revisions to the EIA-923 data. eGRID2018v2 is based on the November 21, 2019 revision to EIA-923 data. Following the release of eGRID2018v2, EIA has released at least 5 additional updates, including a March 5, 2020 release which, among other corrections, revised the Meramec power plant and Plant 31 Paper Mill's data.
Meramec
The annual generation data for the Meramec power plant (ORIS ID 2104) from -2,313,523 MWh to +1,346,084 MWh. This change in generation leads to a small shift in the overall output emission rates for the state of Missouri, the MISO balancing authority, the SRMW eGRID subregion, and the SERC NERC region. While the change in eGRID2018v2 emissions and emission rates was not deemed significant enough to release an updated eGRID2018 version (the change was less than 5%), the table below presents the eGRID2018v2 and revised (based on the March 5, 2020 EIA-923 release) CO2 output emission rates. This data file (XLSX)(25 K) presents the CO2, as well as, the CH4, N2O, CO2e, NOX annual, NOX ozone season, and SO2 output emission rates at the plant, state, BA, eGRID subregion, NERC region, and US level that were affected by this change.
| Level | Name | CO2 total output emission rate (lb/MWh) Old | CO2 total output emission rate (lb/MWh) New |
|---|---|---|---|
| Plant | Meramec | 0.0 | 2,349.6 |
| State | Missouri | 1,699.6 | 1,626.4 |
| Balancing Authority | MISO | 1,292.9 | 1,286.2 |
| eGRID Subregion | SRMW | 1,664.2 | 1,618.0 |
| NERC Region | SERC | 996.2 | 993.0 |
| U.S. | -- | 947.2 | 946.3 |
Plant 31 Paper Mill
Another correction to the EIA 923 data involved two changes for Plant 31 Paper Mill in Louisiana (ORIS ID 50028), including (1) a substantial reduction in fuel consumption of black liquor (from 108,095,474 MMBtu to 9,004,793 MMBtu), and (2) an increase in fuel consumption for electricity generation from natural gas (from 146,196 MMBtu to 932,669 MMBtu). The total net generation at this plant was not changed with these corrections.
Because the eGRID biomass adjustment zeros out all emissions from black liquor at the plant level, the large decrease in black liquor consumption at this plant does not actually result in a decrease in the adjusted eGRID plant-level emissions.
The increase in natural gas consumption for this plant does result in an overall net increase in emissions and fuel consumption at the plant level, as shown in the table below. This increase has a negligible (<0.01%) impact on the state-level rates for Louisiana or the subregion-level rates for SRMV.
| Plant 31 Paper Mill | Existing eGRID data | Revised data |
|---|---|---|
| Plant total annual heat input (MMBtu) | 3,508,188 | 3,632,899 |
| Plant annual net generation (MWh) | 600,966 | 600,966 |
| Plant annual CO2 emissions (tons) | 11,334 | 32,053 |
| Plant annual CO2 total output emission rate (lb/MWh) | 37 | 106 |
| Unadjusted total annual heat input (MMBtu) | 122,244,496 | 21,284,568 |
| Unadjusted annual CO2 (tons) | 13,139,831 | 1,950,049 |
What is Grid Gross Loss (GGL)?
More commonly known as line losses, power losses, or transmission and distribution (T&D) losses, the grid gross loss (GGL) is an estimate of the energy lost in the process of supplying electricity to consumers. These losses mainly occur from energy dissipated in the conductors, transformers, and other equipment used for transmission, transformation, and distribution of power. eGRID provides an estimate expressed as a percent of generation for the United States, each NERC interconnection (i.e., Eastern, Western, and ERCOT), Alaska, and Hawaii. EPA estimates that the GGL is about 5% of the electricity that is transmitted and distributed annually in the United States.
The 2018 GGL estimates are:
| Power Grid | 2018 GGL (%) |
|---|---|
| Eastern | 4.88 |
| ERCOT | 4.87 |
| Western | 4.80 |
| Alaska | 5.12 |
| Hawaii | 5.14 |
| U.S. | 4.87 |
How is GGL calculated?
GGL is calculated by dividing the estimated losses by the result of total disposition minus net interstate exports minus direct use:
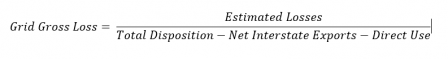 The U.S. Energy Information Administration (EIA) provides data on estimated losses (reported at the utility level via form EIA-861, and then allocated to States based on the utility`s retail sales by State), total disposition (i.e., the sum of station use, direct use, retail sales, sales for resale, and other outgoing electricity), net interstate exports, and direct use (i.e., electricity consumed onsite for all operations other than electric power plant station use) at the state level in the State Electricity Profiles. EPA aggregates the data and presents it for Alaska, Hawaii, and the Eastern, Western and ERCOT NERC interconnections. A map of the interconnections is available here.
Has the GGL methodology changed?
To align more closely with estimates made by EIA, the methodology for calculating eGRID2018 GGL has changed slightly from the previous methodology used to create GGL values for eGRID2014 and eGRID2016. The previous methodology did not account for interstate trade values that were included in total disposition for each state, which ultimately led to a slight double counting of values. The revised methodology excludes net exports from each state’s total disposition. The formula for calculating GGL remains nearly the same as the previous methodology, with the exception that net interstate exports are subtracted from the total disposition in the denominator.
Estimates of GGL from eGRID2012 and earlier used a different formula based on data on generation, imports, and exports from FERC and consumption data from EIA. eGRID2014 and subsequent eGRID editions use only EIA data, as well as a new formula (as described above). The use of one data source minimizes error due to differences in the way EIA and FERC collect data.
Please see the Technical Support Document for more details on the data definitions and methodology.
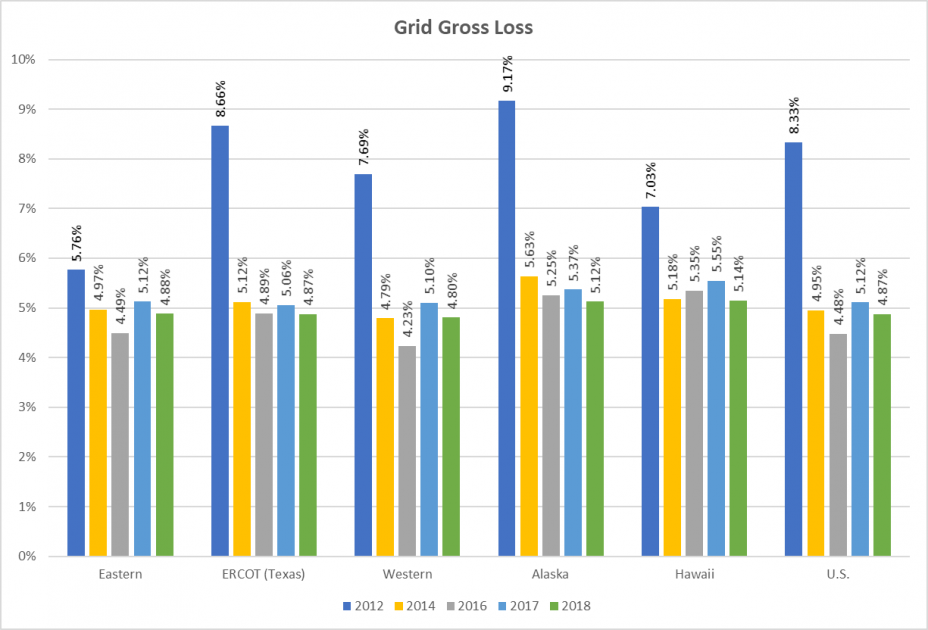
How do the historical GGL values compare?
The 2012, 2014, 2016, 2017, and 2018 GGL values are shown in the following graph:
How has the methodology for assigning plants to eGRID subregions changed?
While the 26 subregions have not changed substantially since conception, the methodology for assigning plants to subregions has been revised, most notably in eGRID2014 and eGRID2016. The subregion emission rates most accurately represent the actual electricity used by consumers by limiting the import and export of electricity within an aggregated area. The subregions were defined by EPA as a compromise between NERC regions (which EPA felt were too big) and balancing authorities (which EPA felt were generally too small).
In eGRID2012 and previous editions, plants were assigned to eGRID subregions based on a variety of factors, including associated NERC region, Power Control Area (PCA), and transmission/distribution/utility service territory. The methodology was revised in eGRID2014 because information about some of these linkages was no longer available and in an effort to make the process for assigning plants to subregions more straightforward, reproducible, and transparent. In eGRID2014, plants were assigned to eGRID subregions by first using the NERC region and then, for the remaining plants, using GIS shapefiles based on a plant’s physical location.
To better meet the intent of the subregions while ensuring that new plants can be assigned consistently and that changes in the electrical grid are captured in subsequent eGRID updates, the methodology for assigning plants to eGRID subregions has been revised again. Since eGRID2016, plants are assigned to subregions using data from EIA and NERC in a five step process. Assignments are based on each plant’s NERC region, Balancing Authority, and transmission/distribution/utility service territory. For a small number of plants, we also use the plant’s NERC Assessment Area. More information about the plant assignment methodology can be found in section 3.4.2 of the Technical Support Document.
How has the methodology for estimating methane (CH4) emissions changed?
The CH4 emissions factors which eGRID uses changed in eGRID2014. eGRID2016 and eGRID2018 continue to use the same factors as used in eGRID2014. The method for estimating CH4 emissions from electricity generation involves multiplying the heat input (mmBtu) by a fuel-specific emissions factor. This is the same methodology used in all editions of eGRID. However, the CH4 emissions factor for all types of coal has been updated in eGRID2014 and subsequent eGRID editions to 0.011 kg CH4/mmBtu from the previous value of 0.001 kg CH4/mmBtu.
The source of these emissions factors is Table C-2 of EPA’s Mandatory Rule on the Reporting of Greenhouse Gases (40 CFR Part 98). Table C-2 includes an emissions factor of 0.011 kg CH4/mmBtu for coal combustion and in the footnote, the table includes the option of using a lower emission factor of 0.001 kg CH4/mmBtu for coal.
While EPA’s Greenhouse Gas Reporting Program allows the use of either emissions factor when reporting emissions, the majority of users choose to use the higher emissions factor.
To maintain consistency with other GHG reporting methodologies, eGRID revised the emissions factor starting with eGRID2014. The table below presents the revised CH4 emissions rates (lbs. CH4/GWh) for eGRID2010 and eGRID2012 at the subregion-level and also presents the eGRID2014 CH4 output emission rates for comparison. Year-to-year differences in the regional CH4 emission rates are explained by changes in each region’s resource mix.
| eGRID Subregion Name | eGRID Subregion Code | CH4 Emission Rate (lb/GWh) | ||
|---|---|---|---|---|
| eGRID2010* (revised) | eGRID2012* (revised) | eGRID2014 | ||
| ASCC Alaska Grid | AKGD | 72.90 | 78.31 | 46.63 |
| ASCC Miscellaneous | AKMS | 20.79 | 20.11 | 36.07 |
| WECC Southwest | AZNM | 109.09 | 103.76 | 66.38 |
| WECC California | CAMX | 53.04 | 51.82 | 33.11 |
| ERCOT All | ERCT | 100.06 | 90.99 | 81.84 |
| FRCC All | FRCC | 112.16 | 102.78 | 87.78 |
| HICC Miscellaneous | HIMS | 203.43 | 171.44 | 95.34 |
| HICC Oahu | HIOA | 150.88 | 157.18 | 159.41 |
| MRO East | MROE | 225.51 | 214.39 | 191.16 |
| MRO West | MROW | 193.35 | 181.64 | 161.37 |
| NPCC New England | NEWE | 114.05 | 99.08 | 96.00 |
| WECC Northwest | NWPP | 99.89 | 79.43 | 97.81 |
| NPCC NYC/Westchester | NYCW | 26.41 | 24.13 | 24.37 |
| NPCC Long Island | NYLI | 121.97 | 121.57 | 132.41 |
| NPCC Upstate NY | NYUP | 63.45 | 40.55 | 30.69 |
| RFC East | RFCE | 101.73 | 79.07 | 73.93 |
| RFC Michigan | RFCM | 195.88 | 177.82 | 170.09 |
| RFC West | RFCW | 180.11 | 156.50 | 150.20 |
| WECC Rockies | RMPA | 195.62 | 176.01 | 178.16 |
| SPP North | SPNO | 193.98 | 183.81 | 173.79 |
| SPP South | SPSO | 159.52 | 152.22 | 135.44 |
| SERC Mississippi Valley | SRMV | 91.70 | 85.67 | 78.63 |
| SERC Midwest | SRMW | 212.76 | 200.16 | 208.84 |
| SERC South | SRSO | 166.56 | 130.27 | 103.71 |
| SERC Tennessee Valley | SRTV | 163.37 | 151.75 | 138.64 |
| SERC Virginia/Carolina | SRVC | 140.92 | 120.23 | 95.72 |
* The 2010 and 2012 CH4 emission rates are recalculated using 0.011 kg CH4/mmBtu emissions factors for coal combustion. The CH4 emission rates in the eGRID2010 and eGRID2012 files have not been changed, those rates are based on the 0.001 kg CH4/mmBtu emission factors for coal combustion.
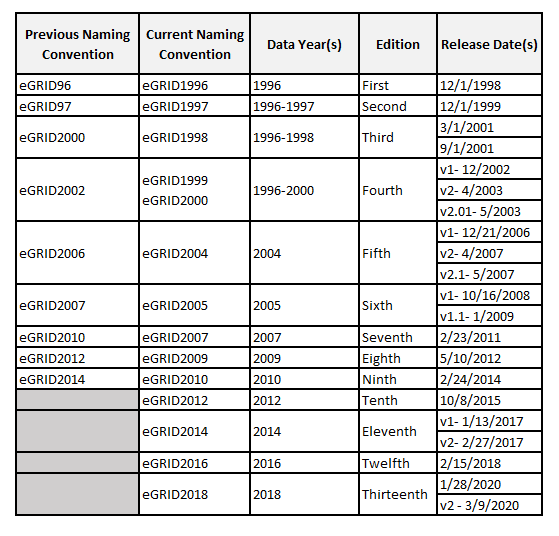
Did the eGRID naming convention change?
Yes, starting with the release of eGRID2012 (October 8, 2015), the naming convention changed. The year noted in the title reflects the data year rather than the release year. For example, the eGRID file released in 2012 with 2009 data was previously named eGRID2012, using the new naming convention it’s now called eGRID2009.
eGRID2012 and subsequent editions (and associated materials) reference previous eGRID editions using the new naming convention and the files available for download from the website use the new naming convention; however, the content within the previous editions of eGRID, such as the technical support documents, has not been revised.
Is there additional eGRID data available?
Yes, additional data files are available. Beginning with eGRID2014, the data are also presented in metric units and are available in the eGRID2018 Metric Data File (XLSX)(15 MB) . The Historical Sequence ID Fields (XLSX)(1 MB) that were reported in the Plant file in past editions of eGRID are now included as a separate file. Also, in addition to the code descriptions available in the Technical Support Document, a Code Lookup file (XLS) (1 pg, 30 K) is available. Table C-5 in the Technical Support Document identifies plants where the EIA Plant ID doesn't match the EPA/CAMD ORISPL ID, that crosswalk is also available here, EPA-EIA Plant ID Crosswalk (XLSX)(11 K) . Images, shapefiles, and geodatabases for are available here. Also, an excel version, Power Profiler ZIP Code Tool(4 MB, 11/12/2020) , of Power Profiler is available.
What do the eGRID subregion and NERC region maps look like?
The maps are representational, many of the boundaries shown on the maps are approximate because they are based on companies, not on strict geographical boundaries. On the Maps webpage, images are available for the eGRID Subregion Map and the NERC Region Map, additionally, an eGRID shapefile and geodatabase are available.
How has the subregion map changed?
The subregion maps were noticeably revised with the release eGRID2012, however no significant changes to the map have been made since then. Beginning with eGRID2012, cross-hatching on the map identifies areas where more than one eGRID subregion may apply. While the majority of zip codes are located within only one eGRID subregion, in some cases a zip code may fall in multiple eGRID subregions because it is supplied by different service providers associated with different subregions. This usually occurs near the borders of two subregions. In eGRID2012, the map identified “secondary” and “tertiary” subregions; however, starting with eGRID2014, the maps simply indicate areas that fall into more than one eGRID subregion without identifying “secondary” and “tertiary” subregions.
If you live in an area with multiple electric service providers (illustrated by cross-hatching on the map), the map isn’t sufficient to tell you the eGRID subregion associated with your location. For this information, you must enter your zip code and electric service provider information into Power Profiler to definitively determine your appropriate eGRID subregion.
The boundaries shown on these maps are not based on strict geographical boundaries. In some cases, plants assigned to a particular eGRID subregion may be located far away from most of the other plants in that subregion. For example, the Intermountain Power Project plant is assigned to the CAMX subregion, yet this plant is located in Utah. This plant was assigned the CAMX subregion based on its balancing authority, which is the Los Angeles Department of Water and Power. GIS shapefiles for the eGRID subregions and NERC regions are available here.
What are the regional emission rates and resource mix?
eGRID subregion, NERC region, and the U. S. summary information for eGRID2018 can be found in summary tables available as either an eGRID Summary Table (XLS) or eGRID Summary Table (PDF) format. The summary tables for data years 2004, 2005, 2007, 2009, 2010, 2012, 2014, and 2016 can be found in the eGRID historical ZIP file.
How can I receive eGRID related news from EPA?
If you are interested in receiving email alerts when eGRID is updated or eGRID related news is released, sign up at eGRID Notification form.
What other emissions data are available from EPA?
Most of the eGRID emission data are from the Clean Air Markets Programs of EPA. In addition to the hourly emission data reported to EPA from power plants affected by the Acid Rain Program and/or the Cross-State Air Pollution Rule, the Clean Air Markets website presents progress reports, power plant emission trends, and emissions tracking highlights. Other EPA emission data sources also provide data on emissions associated with electricity generation. Air Trends Reports are EPA's "report card" on the status of air quality and air pollutant emissions. Reports are published annually, about ten months after year-end. U.S. Greenhouse Gas Inventory Reports include inventories of U.S. greenhouse gas emissions and sinks. Also, see the National Emissions Inventories for the U.S. and the Toxics Release Inventory.
Why are there outliers for some output emission rates?
The output emission rates (e.g. lbs. CO2/MWh) in some eGRID subregions are significantly higher than the rates in other regions. This is particularly true for the emission rates by fuel type, such as the emission rates for oil. For example, the CO2 output emission rate for oil in the RMPA subregion is significantly higher than the oil rates for most other regions. This is due to plants with negative net electricity generation. The generation data in eGRID are from the Energy Information Administration (EIA), which defines net generation as the total gross generation minus station use (which is the amount of electricity used to operate and maintain the electric power plant). In some cases, the amount of station use electricity exceeds the total amount of electricity generated at the plant, and the total net generation is a negative number. However, these plants still have positive emissions. When the emission rates are calculated at the subregion level, the sum of the emissions from all plants in that subregion are divided by the sum of the generation from all plants in that subregion. If there are several plants that report negative net generation, then it can reduce the denominator of that equation and result in a higher overall output emission rate. For a fuel type such as coal or natural gas, which is the primary fuel type for many plants in each region, negative net generation does not have much impact on the overall emission rate. For a fuel type such as oil, which is the primary fuel type for relatively few plants in each region, negative net generation may have much more of an impact on the emission rates.
Why are there differences at a small number of plants between total net generation and generation by fuel type?
eGRID reports both the total net generation (MWh) and net generation from each fuel type at each plant in the Plant file. For a relatively small number of plants (less than 0.1%), the sum of the generation by fuel type does not equal the total net generation at the plant. The reason for this is because eGRID uses two different data sources from the Energy Information Administration (EIA) to determine net generation at each plant. EIA provides net generation at the unit level for a subset of plants in the United States. It also provides net generation at the prime mover level for all plants. The net generation in the Generator file is based on unit-level generation data where available. For generators where unit-level generation data are not available, the generation is based on prime mover-level generation, distributed to each unit based on proportion of nameplate capacity. The total plant-level net generation in the Plant file is the sum of net generation at each plant from the Generator file. The generation by fuel type in the Plant file is based only on the prime mover-level generation data. But there are some cases where there are discrepancies between the unit-level and prime mover-level data from EIA. As a result, there are a handful of plants where the total plant-level generation does not equal the sum of the generation by fuel type.
What other EPA tools are available to estimate avoided emissions from EE/RE programs?
The AVoided Emissions and geneRation Tool (AVERT) calculates avoided PM2.5, NOx, SO2, and CO2 emissions of energy efficiency and renewable energy (EE/RE) policies and programs. Use AVERT’s web edition or Excel-based tool to create custom calculations that reflect variations in hourly impacts of different EE programs or RE resources within one of AVERT’s ten regions. For example, users can select among wind, solar, and different EE savings options (“load impact profiles”) within the tool.
AVERT produces outputs including maps, charts, and tables, that display the location of emission reductions at the regional, state, and county level, on a monthly and annual basis. Custom analysis using the Excel-based tool can be used for short-term Clean Air Act Plan demonstrations, such as NAAQS SIPS, state-wide EE/RE policies, and multi-state analysis.
In 2017, EPA published the first set of AVERT-generated regional and national emission factors. Analysts can use these emission factors to compare the emissions impacts of wind, solar, and energy efficiency program impacts.
How can I provide feedback or ask questions?
Your input and feedback is greatly appreciated. Fill out this short survey to let us know how you use eGRID, what data you currently use, what features you would like in subsequent versions, and suggestions for improvements. Additionally, if you have questions or comments, you can submit them through this web form or email EPA directly.