Ecosystem Rarity Toolbox
Relative Ecosystem Rarity
- As conservation goals progress from preserving single species to protecting entire ecosystems, new measures of ecosystem rarity may be useful. Ecosystem-based conservation calls for an understanding of the relative rarity of individual ecosystems at multiple scales.
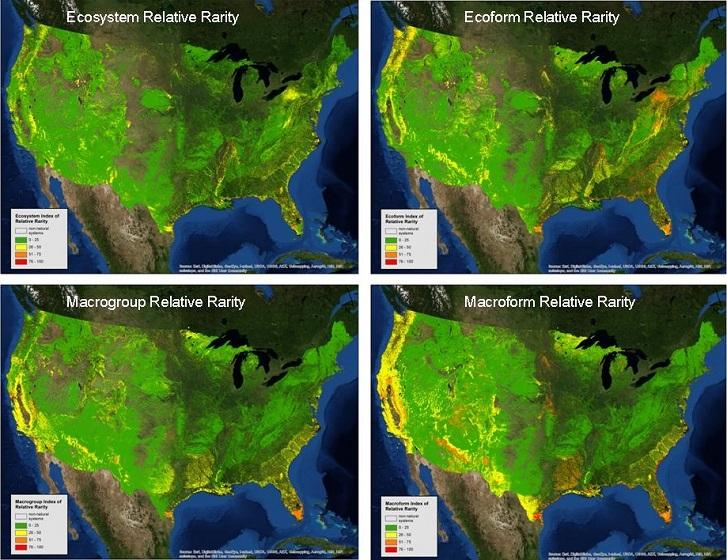
- EnviroAtlas includes several data layers that measure relative ecosystem rarity for the nation, using a newly developed Ecosystem Relative Rarity metric.
- For more information on EnviroAtlas ecosystem relative rarity, read the Rare Ecosystems Fact Sheet.
 A nationwide overview of the 4 ecosystem rarity metrics.
Ecosystem Rarity Toolbox
This toolbox allows users to calculate multiple measures of relative ecosystem rarity for their specific areas of interest. This toolbox requires USGS GAP Land Cover data, which can be downloaded from the USGS GAP website.
Ecosystem Rarity Toolbox (ZIP)(634 K, December 2013)
- Ecosystem based conservation efforts may benefit from a measure of ecosystem rarity. The U.S. EPA has developed four measures of ecosystem rarity and an ArcGIS Toolbox that allows users to calculate these metrics for their specific areas of interest.
- The four measures vary slightly in calculating relative rarity. The EnviroAtlas uses the Ecoform Relative Rarity Metric but all four metrics provide information that may be of use to land managers or other researchers.
- All four relative rarity metric tools are included in this toolbox. These metrics were presented to the international community at the 2013 International Congress for Conservation Biology in July 2013.
Ecosystem Relative Rarity
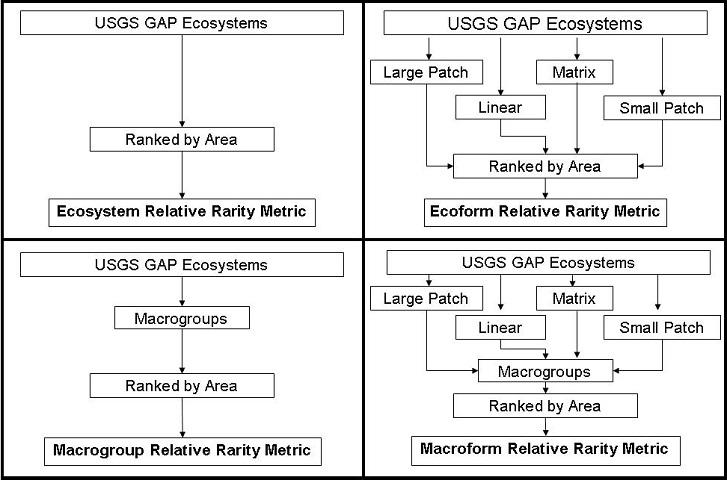
This metric uses a simple sorting and normalized ranking of 0 to 100 of all natural ecosystems by area. The higher values indicate a greater rarity within the area of interest.
Ecoform Relative Rarity
- This metric sorts the natural ecosystem types into one of four spatial pattern categories: large patch, small patch, matrix, or linear.
- These spatial pattern categories identify broad ecosystem types. For example, linear ecosystems tend to be either riparian or coastal in nature.
- Within the ecosystem type categories, the systems are then sorted by area and ranked on a normalized scale from 0 to 100.
- The higher values indicate a greater rarity within the area of interest.
Macrogroup Relative Rarity
- This metric uses the National Vegetation Classification (NVC)Exit to aggregate the natural ecosystems up a level in the taxonomy to the Macrogroup.
- The Macrogroups are then sorted by area and ranked on a normalized scale from 0 to 100, which is then applied back to the ecosystem level.
- The higher values indicate a greater rarity within the area of interest.
Macroform Relative Rarity
- This metric combines the methods used in the macrogroup and ecoform metrics.
- The natural ecosystems are first sorted into one of four spatial pattern categories: large patch, small patch, matrix, or linear.
- Then the metric uses the National Vegetation Classification (NVC)Exit to aggregate the ecosystems up a level in the taxonomy to the Macrogroup.
- The Macrogroups within each spatial pattern are then sorted by area and ranked on a normalized scale from 0 to 100, which is then applied back to the ecosystem level.
- The higher values indicate a greater rarity within the area of interest.
 The sorting process used in the ecosystem rarity toolbox.
