EnviroAtlas Data Organization
EnviroAtlas contains over 400 data layers for users to explore. Data in our Interactive Map are organized into five main tabs:
Featured Collections
Featured Collections are clusters of data that highlight different environmental decision-making scenarios. These subsets of data allow users to explore and understand a curated selection of data around a topic of interest. Featured Collections that are available include the following:
- Agricultural Erosion and Sediment-Impaired Waterways
- Building a Greenway: A Case Study
- Nitrogen Inputs to Watersheds
- Urban Heat Islands and Vulnerable Populations
EnviroAtlas Data
The majority of the 400+ datasets found in EnviroAtlas are developed in-house by the EnviroAtlas team, and with partners. Sometimes helpful outside datasets, such as Protected Lands or GAP data, are also provided as web services in the interactive map.
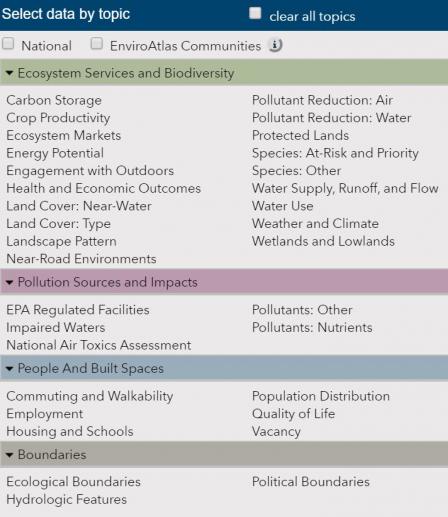
EnviroAtlas data are organized into one of four categories, based on the type of information they cover.
Ecosystem Services and Biodiversity
 Screenshot of the EnviroAtlas interactive map filter showing available data topics. Ecosystem Services and Biodiversity data are organized into 19 topics to help guide users to data of interest (see image). Users can also select whether they want to see all data, or just those datasets that are available at the National or Community extents.
Ecosystem Services and Biodiversity data also have one or more assigned ecosystem service benefit categories to indicate their linkages to the supply, demand, and drivers of change associated with ecosystem services. Learn more.
Pollution Sources and Impacts
Pollution Sources and Impacts data provide information on various pollutants, facilities reporting to EPA for pollutants, and impacted waterways. The individual data categories are as follows:
- EPA Regulated Facilities: Contains data from different facilities that report to EPA about air pollution, hazardous waste sites, Superfund, etc.
- Impaired Waters: Shows national 303d impaired waters and stream length impaired by various contaminants, summarized by HUC12.
- National Air Toxics Assessment: EnviroAtlas provides a selection of the National Air Toxics Assessment (NATA) 2014 estimates for ambient concentrations and health-effect results by 2010 census tracts, counties, and states. This dataset is based on data from 2014 NATA, which was produced by the US EPA to estimate health risks from toxic air pollutants.
- Pollutants: Nutrients: Includes national data for nitrogen and phosphorus inputs and other data related to nutrient pollution
- Pollutants: Other: Contains national data for pollutants other than nutrients.
People and Built Spaces
Contains data related to the built environment, including commuting and vacancy rates.
- Commuting and Walkability: Contains national and community extent data on commuting, travel times, and walkability indicators.
- Employment: Contains national extent data on employment and workers.
- Housing and Schools: Contains national and community extent data on facilities such as daycare centers and schools.
- Population Distribution: Includes dasymetric allocation of population and population by HUC12.
- Quality of Life: Includes income thresholds for quality of life. These data are available by census block group for the nation.
- Vacancy: Includes metrics on residential and business vacancy rates.
Boundaries
- Ecologic Boundaries: Includes GAP Ecological Systems and USEPA Ecoregions
- Hydrologic Features: Includes Hydrologic Unit Code boundaries and labels, the NHD Plus V2 dataset, and waterscapes data
- Political Boundaries: Includes political boundaries (congressional districts, states, counties, census block groups), EnviroAtlas community boundaries, Landscape Conservation Cooperatives, and USEPA Regions.
Demographic Layers
The Demographic widget contains hundreds of demographic datasets sourced from the 2012-2016 American Community Survey (ACS) & the US 2000 & 2010 Census. The widget contains:
- hundreds of demographic variables
- user-preferred symbology (choropleth OR markers)
- and scale-dependent data displays that recalculate by state, county, census tract, or census block group when the map is zoomed in or out
Time Series Layers
Climate Projections out to 2099 & Historical Climate Data 1950 - 2005
The NASA Earth Exchange (NEX) scientific collaboration platform has made available downscaled CMIP5 climate projections for the conterminous United States with a spatial grid resolution of 800 meters. The EnviroAtlas team has converted these large complex files into a geospatial format and has made them available through two tools in the EnviroAtlas Interactive Map. Each tool includes four RCP scenarios (2.6, 4.5, 6.0, and 8.5) and four climate variables (minimum temperature, maximum temperature, precipitation, and evapotranspiration).
Add Data
Add Data allows users to easily bring outside data into the EnviroAtlas mapping application. Users can search for and add available web services, input a known URL, or add data from their local machine.
** Data added to the interactive map are available only for that map session and are not saved in EnviroAtlas.
