Inventory of U.S. Greenhouse Gas Emissions and Sinks
About the Emissions Inventory
EPA has prepared the Inventory of U.S. Greenhouse Gas Emissions and Sinks since the early 1990s. This annual report provides a comprehensive accounting of total greenhouse gas emissions for all man-made sources in the United States. The gases covered by the Inventory include carbon dioxide, methane, nitrous oxide, hydrofluorocarbons, perfluorocarbons, sulfur hexafluoride, and nitrogen trifluoride. The Inventory also calculates carbon dioxide removal from the atmosphere by “sinks,” e.g., through the uptake of carbon and storage in forests, vegetation, and soils.
The national greenhouse gas inventory is submitted to the United Nations in accordance with the Framework Convention on Climate Change Exit. In preparing the annual emissions inventory report, EPA collaborates with hundreds of experts representing more than a dozen U.S. government agencies, academic institutions, industry associations, consultants and environmental organizations. EPA also collects greenhouse gas emissions data from individual facilities and suppliers of certain fossil fuels and industrial gases through the Greenhouse Gas Reporting Program.
Overview of Greenhouse Gases and Sources of Emissions
Key findings from the 1990-2018 U.S. Inventory include:
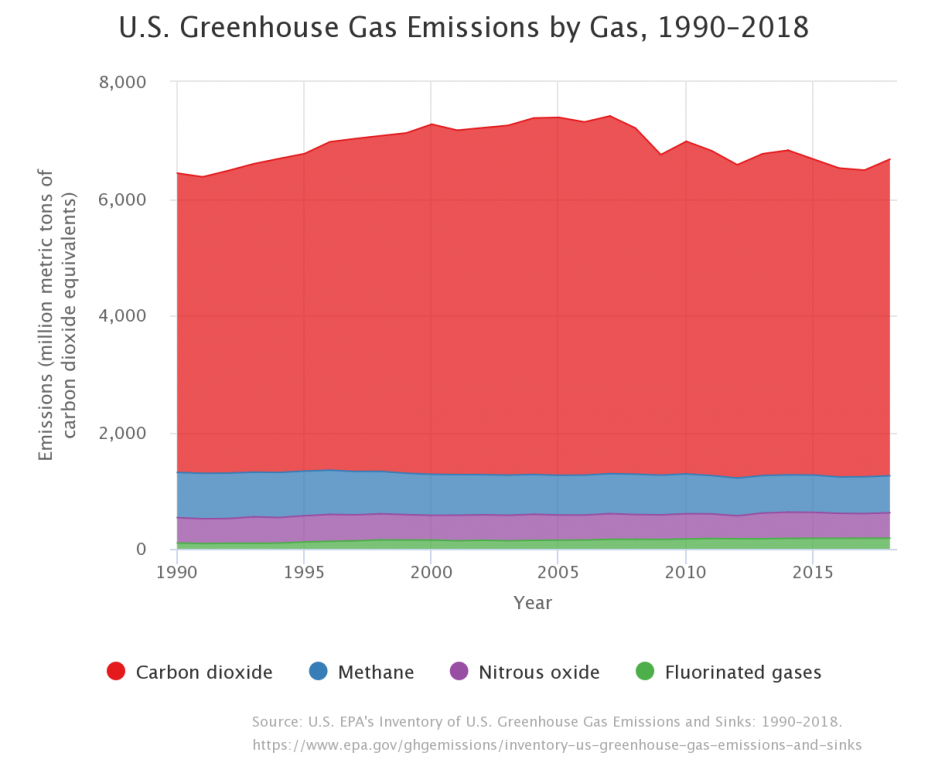
- In 2018, U.S. greenhouse gas emissions totaled 6,677 million metric tons of carbon dioxide equivalents, or 5,903 million metric tons of carbon dioxide equivalents after accounting for sequestration from the land sector.
 Larger image to save or printEmissions increased from 2017 to 2018 by 3.1 percent (after accounting for sequestration from the land sector). This increase was largely driven by an increase in emissions from fossil fuel combustion, which was a result of multiple factors, including more electricity use greater due to greater heating and cooling needs due to a colder winter and hotter summer in 2018 in comparison to 2017.
- Greenhouse gas emissions in 2018 (after accounting for sequestration from the land sector) were 10.2 percent below 2005 levels.
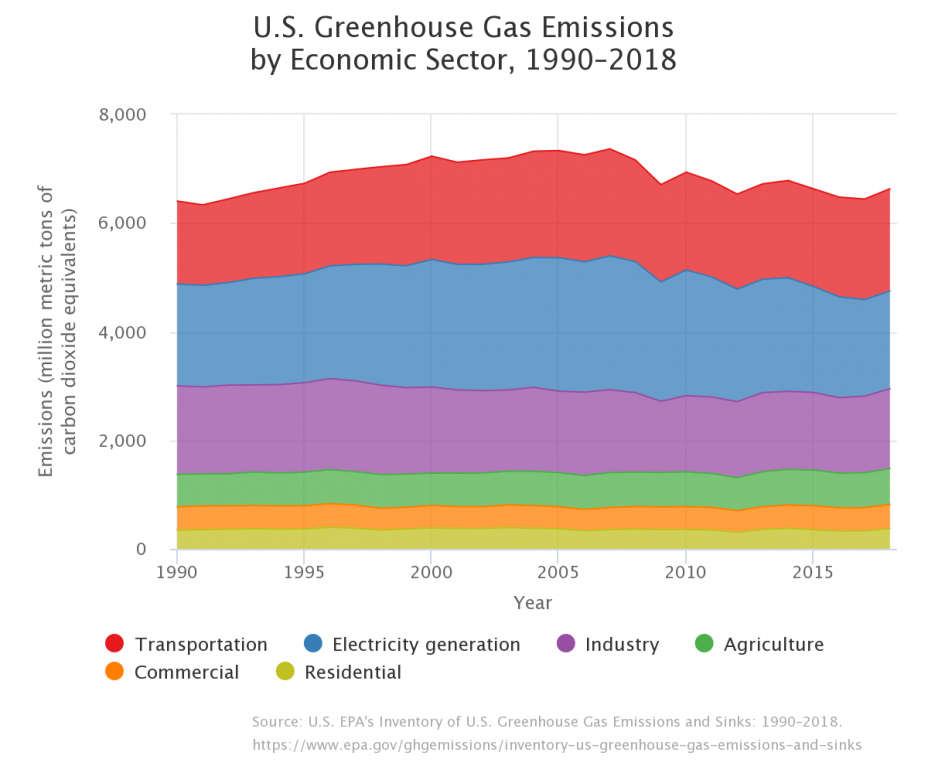
 Larger image to save or printThe graphs to the right provide an overview of greenhouse gas emissions in the United States based on information from the Inventory. To learn more about each of these topics, click on the links below:
See the Data
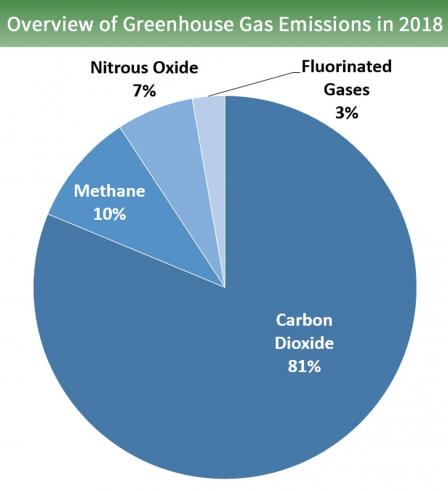
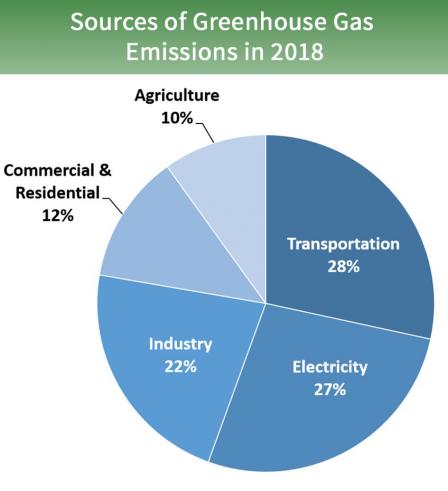
EPA has developed an interactive tool that provides access to data from the national greenhouse gas inventory. Visit the Greenhouse Gas Inventory Data Explorer to create customized graphs, examine trends over time, and download the data. The graphs below are examples from EPA’s Greenhouse Gas Inventory Data Explorer. Click either image to enter the tool and explore an interactive version of the graph.