GHGRP Suppliers of Natural Gas and Natural Gas Liquids


 This sector consists of entities that supply natural gas and natural gas liquids. Natural gas supply is reported by Local Distribution Companies (LDCs) and natural gas liquids (NGL) supply is reported by fractionators.
NGL Fractionators are installations that receive natural gas or bulk natural gas liquids from producers, fractionate these raw inputs into individual products (ethane, propane, normal butane, isobutane, or pentanes plus), and then supply those products into the economy.
Local Distribution Companies receive natural gas from a transmission pipeline company and physically deliver the gas to end users.
These Suppliers report the quantity of CO2 that would be emitted if the fuels they supply each year were combusted. Emissions associated with these fuels do not occur at the supplier's facility but instead occur throughout the country, wherever they are used. The full GHG quantity reported by suppliers might not always result in GHG emissions, and the emissions might not take place during the year in which they are reported. An example is ethane supplied by NGL fractionators, which is often used to produce plastics.
The GHG quantities reported by suppliers can be accessed through the suppliers section of FLIGHT. Some natural gas and natural gas liquids suppliers also report direct emissions from petroleum and natural gas operations. Click here to learn more.
- Graphic of the natural gas and NGL supply chain
- Trend of annual reported CO2 quantity associated with natural gas and NGL supply
- Emissions and deliveries
Graphic of the natural gas and NGL supply chain
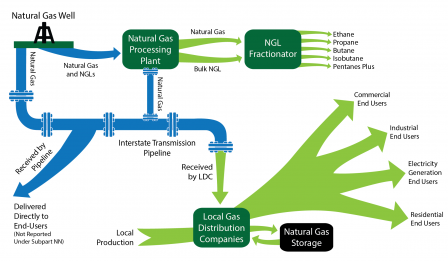
Quantities marked with green arrows are reported to EPA by NGL Fractionators or Local Distribution Companies under Subpart NN.
Trend of annual reported CO2 quantity associated with natural gas and NGL supply
What factors influenced the trends in emissions for suppliers of natural gas and natural gas liquids?
Emissions and Deliveries
| Natural Gas and Natural Gas Liquids Suppliers Sector – Carbon Dioxide Quantity Reported to the GHGRP (million metric tons CO2) |
|||||||||
|---|---|---|---|---|---|---|---|---|---|
| 2011 | 2012 | 2013 | 2014 | 2015 | 2016 | 2017 | 2018 | 2019 | |
| Local Distribution Companies | |||||||||
| Number of reporters: | 381 | 386 | 385 | 383 | 383 | 381 | 379 | 376 | 365 |
| CO2 Quantity | 715.9 | 709.5 | 771.9 | 792.2 | 765.7 | 752.7 | 743.1 | 814.6 | 822.4 |
| Natural Gas Liquids Fractionators | |||||||||
| Number of reporters: | 116 | 119 | 126 | 130 | 126 | 125 | 125 | 124 | 123 |
| CO2 Quantity a | 211.5 | 234.3 | 222.8 | 263.3 | 293.2 | 308.8 | 320.2 | 358.8 | 403.0 |
a Excludes CO2 reported by NGL Fractionators whose reported quantities are classified as confidential business information (CBI).
| Natural Gas Deliveries Reported by LDCs (Mscf) | |||||||||
|---|---|---|---|---|---|---|---|---|---|
| End-User | 2011 | 2012 | 2013 | 2014 | 2015 | 2016 | 2017 | 2018 | 2019 |
| Total Reported Deliveries | 12,833,353,747 | 12,814,244,074 | 13,959,558,590 | 14,402,368,456 | 13,884,740,129 | 13,567,837,837 | 13,431,234,983 | 14,800,395,720 | 14,879,467,101 |
| Residential Customers | 4,639,182,835 | 4,085,716,741 | 4,848,463,986 | 5,005,539,667 | 4,545,932,813 | 4,289,324,817 | 4,350,008,201 | 4,917,406,083 | 4,925,166,748 |
| Commercial Customers | 3,040,460,385 | 2,807,075,083 | 3,195,684,202 | 3,372,005,196 | 3,109,690,450 | 3,021,582,505 | 3,073,980,646 | 3,390,058,125 | 3,412,551,457 |
| Industrial Customers | 3,294,130,257 | 3,518,276,435 | 3,673,846,067 | 3,788,452,965 | 3,689,029,269 | 3,764,025,456 | 3,842,469,638 | 4,018,118,682 | 3,990,752,206 |
| Electricity Generating Facilities | 1,859,580,270 | 2,403,175,815 | 2,241,564,335 | 2,236,370,627 | 2,540,087,597 | 2,492,905,059 | 2,164,776,498 | 2,474,812,830 | 2,550,996,690 |
Mscf means thousand standard cubic feet of gas.