Measuring Heat Islands
- Designing an Approach for Assessing Your City’s Heat Island
- Clarifying Objectives
- Identifying Data Needs
- Key Considerations
- Sources for Historical and Current Temperature Data
- More Information
Designing an Approach for Assessing Your City’s Heat Island
Is your city an urban heat island? Where are the “hot spots” and cooler areas within the city? Do vulnerable populations, such as older adults or low-income individuals, live in warmer neighborhoods? The information on this page can help you answer these questions. It takes you through steps for designing an approach to determine whether the heat island effect is impacting your city, and if so, how.
You start by clarifying your objectives, which will help focus your efforts on finding and analyzing information that serves your needs. You can then move on to design an overall approach, which involves defining the geographic area you will study (where), identifying relevant times of day and season (when), and considering what types of data are appropriate.
After you have designed your approach and are ready to begin the actual assessment, you can use the information at the end of this page to find sources of existing data and references to detailed protocols and methodologies for collecting and analyzing temperature and other information.
This page provides a simple decision framework and key considerations to keep in mind when designing an assessment of your city’s heat island effect. It does not present a detailed “how-to” for completing a comprehensive heat island analysis, as the specific steps you undertake will depend on your objectives, the types of data you decide to use, and your available resources.
Clarifying Objectives
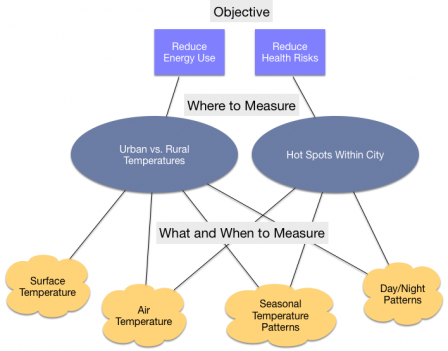 A simplified decision tree for selecting an approach to assessing a city’s heat island. It starts with defining an objective, which determines the type and location of temperature data required, which in turn determine what and when to measure.The first and most critical step is to define the objectives you are trying to achieve. There are many reasons to undertake a heat island assessment, but the two most common are:
- Understanding energy implications: Higher urban temperatures drive demand for air conditioning, leading to higher energy bills during the warmer months of the year. Analyzing how temperatures in an urban area differ from those in the surrounding region will help you quantify the energy impacts.
- Understanding public health risks: Heat islands can contribute to poor air quality, magnify the impacts of extreme heat events, and put people’s health at higher risk. Identifying hot spots within a city can help focus interventions where they are most needed during heat waves.
Identifying Data Needs
After clarifying the objectives, you are ready to determine the geographic coverage of your data collection effort, the kind of data needed (air vs. surface temperatures, or both), and where you can find useful sources of existing temperature data. Your objectives will determine your data needs and sources.
Geographic Coverage (Where)
- Assessments focused primarily on energy-related impacts of heat islands typically compare the temperature in the overall urban area with the temperature in the surrounding rural area to determine how much additional energy demand is caused by the urban heat island.
- Assessments focused on health-related impacts of heat islands typically focus on assessing the differences in air temperatures among different locations within the city (i.e., identifying hot spots).
Types of Temperature Data (What) and Technologies for Capturing Data (How)
The next step after deciding where to measure is choosing whether to collect data on air temperatures, surface temperatures, or a combination of both.
- Air temperatures important for assessing heat islands are those found within the urban canopy, from ground level to the tops of trees and buildings. They are most useful for a study whose goal is to mitigate public health risks since they are the best indicators of conditions actually experienced by people. Air temperatures can be measured directly using standard weather stations and other monitoring instruments and/or mobile traverses (cars with sensors that record temperatures along a fixed line). However, because monitoring networks and traverses typically cover just a portion of the city’s area, they may not provide a representative picture of citywide temperatures. Urban climate models can be used in conjunction with observed data to estimate temperatures in places where no field data are available.

- Surface temperatures represent heat energy given off by the land, buildings, and other surfaces. Technologies that measure temperatures of surfaces, such as instruments mounted on satellites and airplanes, can provide better geographic coverage than those used for recording air temperatures. They can reveal temperature differences at very fine scales: for example, between roofs, pavements, and grassy areas. Satellite data, however, have a number of limitations (see “Considerations for Measuring Surface Temperatures” below). A combination of satellite data for surface temperatures and data from monitoring stations or traverses for air temperatures offers the most complete picture of a city’s heat island.
- Seasonal and daily temperature patterns are another data element to consider. For example, nighttime temperatures can pose higher health risks than daytime temperatures, and heat islands can exist in seasons other than summer.
Key Considerations
Accurately assessing a city’s heat island is a complex undertaking, with many variables at play. It is important to take into account the key considerations listed below when designing your approach.
Considerations for Measuring Air Temperatures
- Assess and map the locations of existing data monitors (such as standard weather stations and other monitoring networks) to identify areas of the city with information gaps relevant to your specific analysis.
- Choose data collection sites that are representative of their surroundings in terms of surface materials, geometry, and human activity.
- Establish a reasonable number of monitoring sites in order to avoid bias (e.g., comparing data from just one urban site with data from one rural site may not accurately characterize a city’s heat island).
- Follow a consistent protocol for the location of monitors, the height and direction of sensors, shielding from sunlight, and other key factors that may influence recorded temperatures. For example, rooftops are a popular location for air temperature monitors, but recorded temperatures could be inaccurate if the monitors are too close to heating, ventilation, and air conditioning equipment on the roof.
- Clearly document the study’s methodology and metadata (e.g., time period, spatial area).
Considerations for Measuring Surface Temperatures
Surface temperatures can be indirectly measured using satellites, aircraft, and ground-based instruments. While it is possible to estimate air temperatures from surface temperature data, the estimates are less reliable than direct measurements.
- Satellites provide extensive geographic coverage, but cannot portray the finer details of hot spots within neighborhoods. Trees or tall buildings may prevent satellites from accurately capturing the temperatures of surfaces at ground level. Data are collected only during the times when a satellite passes over a city, and are available only for clear weather conditions.
- Surface temperature data from aircraft-borne instruments offer higher resolution than those from satellites, since airplanes fly at lower altitudes, but aircraft data are more expensive and provide irregular coverage.
- Ground-based thermal sensing (e.g., using hand-held instruments that are pointed at surfaces to measure their temperature) can be used to get surface temperature data for specific urban features (e.g., parking lots versus city parks) or different surface types, such as light-colored roofs versus dark roofs.
Sources for Historical and Current Temperature Data
After you have clarified the goals of your heat island assessment and determined what, where, and how to get data on temperatures, you are ready to begin finding and analyzing data. Some of the data you need may already exist (see tables below for common sources of historical and current no-cost data on air and surface temperatures), but it is important to remember that you may still need to conduct your own field work to get the most accurate picture of your city’s heat island.
Air Temperature Data
| Data Source | Description | Links |
|---|---|---|
| NOAA National Centers for Environmental Information: Climate Data Online | Free access to National Climatic Data Center’s archive of global historical weather and climate data in addition to station history information. Data include quality controlled daily, monthly, seasonal, and yearly measurements of temperature, precipitation, wind, and degree days as well as radar data and 30-year Climate Normals. NOAA also manages UrbaNet, a data network focused on urban environments in major U.S. cities. Note that much of the data provided by NOAA (except for data in the UrbaNet network) may be for non-urban areas. | Website |
| National Weather Service Stations | The National Weather Service stations can provide local weather statistics for temperature, precipitation, degree days, wind, humidity, etc. Note that much of the data may be for non-urban areas. | Website |
| NCEP/NCAR Reanalysis Project | The NCEP/NCAR Reanalysis Project uses an analysis/forecast system to perform data assimilation using past data from 1948 to the present. The data set provides 4-times daily, daily, and monthly values for surface and air temperature from 1984 to present. | Data |
Surface Temperature Data
| Data Source | Description | Links |
|---|---|---|
| NASA’s Moderate Resolution Imaging Spectroradiometer (MODIS) | Surface temperature can be measured by seven solar and three thermal spectral bands of MODIS when there are clear skies. Each pixel has a 1km resolution. | Data Example |
| NOAA’s Advanced Very High Resolution Radiometer (AVHRR) | AVHRR is a radiation-detection imager that can be used to remotely determine surface temperature. The satellite is still active. The ground resolution is about 1.1 km. | Data Example |
| Landsat Thematic Mapper and Enhanced Thematic Mapper Plus | These two sensors provide thermal infrared imagery and data that can be used to calculate surface temperature and urban heat island. The Landsat Thematic Mapper was active from 1982-2012 on a 16-day repeat cycle. The Enhanced Thematic Mapper has collected images since 1999 on a 16-day repeat cycle (images after 2003 have data gaps due to the Scan Line Corrector failure). The thermal band from both sensors is used for measuring urban heat islands (120m and 90m resolution, respectively, although the band was resampled at 30m resolution for both). | Thematic Mapper and Enhanced Thematic Mapper Plus Data Example |
| NCEP/NCAR Reanalysis Project | The NCEP/NCAR Reanalysis Project uses an analysis/forecast system to perform data assimilation using past data from 1948 to the present. The data set provides 4-times daily, daily, and monthly values for surface and air temperature from 1984 to present. | Data |
More Information
After you have finished designing an approach for assessing your city’s heat island, you can find detailed guidance on implementing the assessment, including step-by-step procedures and protocols here:
- Stewart, I., 2010. A Systematic Review and Scientific Critique of Methodology in Modern Urban Heat Island Literature. Recommendations for effective design and implementation of heat island assessments.
- Oke, T., 2006. Guidance on Obtaining Representative Meteorological Observations at Urban Sites. Considerations for the siting of ground-based instruments.
- City of Cambridge, Massachusetts, 2015. Urban Heat Island Protocol for Mapping Temperature Projections. Step-by-step documentation on how the City of Cambridge obtained and analyzed satellite data to measure current surface temperatures in the city, estimate air temperatures, calculate a heat index, and develop projections of future temperatures.