Legacy Documents for the New Bedford Harbor
This page contains documents which are of historic interest but no longer considered current.
You may need a PDF reader to view some of the files on this page. See EPA's About PDF page to learn more.
- Environmental Monitoring Data
- Sediment Dredging Progress Monitoring
- Historic Annual Dredging Reports
- Outer Harbor Study
- Earlier Cleanup Actions
- Site Videos
- Aerovox Mill Demolition
- Other Relevant Documents
Environmental Monitoring Data
Sediment Trap
EPA collects additional information about sediment that may move through the water from natural events such as currents and tidal flow, or man-made activity such as boating or dredging. When the sediment settles back down on the harbor bottom it can be trapped and monitored to determine its amount and potential concentration of PCBs. Sediment trap samples are collected during active dredging periods and during the de-mobilization of dredge-related equipment.
- Sediment Trap Study Summary Report, 2010 Remedial Dredging (PDF) (pp 2,150 - 2,769 of 2,960 pp, 107 MB)
- Sediment Trap Study Summary Report, 2009 Remedial Dredging (PDF) (pp 1,812 - 2,384 of 2,590 pp, 167.5 MB)
- NBH Sediment Trap Report 2008 (PDF) (pp 876 - 931 of 1,327 pp, 91.9 MB)
Sediment Dredging Progress Monitoring
Sediment samples are collected before, during and after each cleanup season as one of the fundamental ways to track the progress and final results of the dredging operations. Environmental scientists study the sediment samples to identify the concentration of PCBs or other contaminants in the sediment. These samples provide vital information for EPA to determine extent of cleanup success and develop the dredge plan for the upcoming year.
- Sediment Monitoring Summary Report, 2012 Remedial Dredging (PDF) (1,069 pp, 43.7 MB)
- Sediment Monitoring Summary Report, 2011 Remedial Dredging (PDF) (1,159 pp, 15.8 MB)
- Sediment Monitoring Summary Report, 2010 Remedial Dredging (PDF) (pp 415 - 1,809 of 2,960 pp, 107 MB)
- View more Sediment Dredging Progress Monitoring documents.
2012 Near-Shore Boring Program Adjacent to the Former Aerovox Facility
The former Aerovox facility was the primary source of PCBs discharged to the Acushnet River and New Bedford Harbor. In 2012, twelve sediment/soil borings were advanced to bedrock in the near-shore area adjacent to the former Aerovox facility to obtain a vertical profile of remaining PCBs and select solvents in and under the marine sediment. The 2012 boring program provided an updated examination of the near-shore sediment contamination in New Bedford Harbor, abutting the Aerovox Site. The results of this boring program will be used in the design and scheduling of further dredging along the shoreline as part of the overall remediation of the New Bedford Harbor Superfund Site.
- Final Technical Memorandum, Summary of Findings, New Bedford Harbor Superfund Site, 2012 Near-Shore Boring Program Adjacent to the Former Aerovox Property, April 2013 (PDF) (63 pp, 18.4 MB)
- Final Report, Sediment Boring Collection and Analysis Off the Former Aerovox Site Property Shoreline, New Bedford Harbor Superfund Site, April 2013 (PDF) (2,460 pp, 461 MB)
Historic Annual Dredging Reports
Annual dredge reports were generated by the project team to provide documentation of the key activities performed and the progress achieved at the New Bedford Harbor site between 2004-2015 when work accelerated with funding provided by the 2013 cash out settlement with a major responsible party. These reports, sometimes called After Action Reports, are generated after a dredging cycle has been completed. Below are the reports from harbor dredge seasons since 2004 as well as reports from the hot spot dredging in 1997, north of Wood Street dredging in 2002 and north lobe dredging in 2005.
- 2013 Dredge Season Data Submittal New Bedford Harbor Remedial Action, December 2014 (PDF) (58 pp, 1.6 MB)
- 2012 Dredge Season Data Submittal New Bedford Harbor Remedial Action, May 2013 (PDF) (86 pp, 1.5 MB)
- 2011 Dredge Season Data Submittal New Bedford Harbor Remedial Action, March 2013 (PDF) (153 pp, 1.1 MB)
- View more Annual Dredging reports.
Outer Harbor Study
Starting in late 2009, EPA initiated a Remedial Investigation (RI) of approximately 17,000 acres located south of the hurricane barrier, known as the outer harbor. The RI includes field sampling activities to determine the nature and extent of contamination, a risk assessment, a review of technologies and range of response actions to address any risk found. The RI for the outer harbor has been completed and resulted in an explanation of significant differences (ESD6) (PDF) (9 pp, 728 K). EPA will continue to keep the public informed about the progress of the outer harbor study at the monthly public meetings.
Earlier Cleanup Actions
Hot Spot Cleanup
The EPA's original 1990 remedy for the hot spot area included dredging and on-site incineration of those PCB-contaminated sediments above 4,000 ppm. Due to a vehement and congressionally-supported reversal of local support for incineration, EPA elected to postpone the incineration component of the hot spot remedy and explore alternative treatment approaches. Dredging of the 14,000 cubic yards of sediment from the 5 acre hot spot areas was accomplished from April 1994 to September 1995, with the dredged sediment temporarily stored in a lined and covered holding pond. Seawater removed from the sediments during dredging was treated on site. Pilot studies of solidification and chemical destruction technologies were completed in the fall of 1996, and a feasibility study of alternative remedial approaches was issued in December 1997. EPA issued an Amended Record of Decision (ROD) in April 1999 which included dewatering and off-site landfill disposal as the final component for the hot spot remediation. Transportation of the hot spot sediment to an offsite TSCA permitted landfill started in December 1999 and was completed in May 2000.
Other Earlier Cleanup Projects & Maps
- Areas Remediated through 2008 (PDF) (1 pg, 592 K)
- Areas Remediated through 2007 (PDF) (1 pg, 657 K)
- View other Earlier Cleanup Projects & Maps.
Early Sediment Sampling Work "Sediment Characterization"
- Sediment Data Collected Through April 2003 - Total PCBs (MG/KG) (PDF) (154 pp, 2.6 MB)
- Inferred PCB Levels - 0 to 12 Inch Depth, May 2001 (PDF) (1 pg, 336 K)
- 2008 Wetland Sediment Core Locations Update (PDF) (10 pp, 3.4 MB)
- View more Early Sediment Sampling Work documents.
Site Videos
- How the Cleanup of New Bedford Harbor Works Exit
- A New Vision for the Harbor
- History of Harbor Pollution
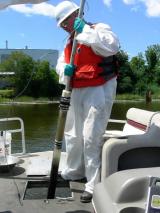
Aerovox Mill Demolition
Air Data Results During the Demolition
Four air monitoring stations were around the Aerovox Demolition project and took daily measurements of particulate matter (dust particles) in the air. Learn more about particulate matter.
The results were measured in micrograms of particle per cubic meter and were shown alongside the meteorological (MET) results for the average wind speed and direction.
Below is a chart that explains the color coding system for the work day messages that were made available to the surrounding communities.
Lab-Validated Air Sampling Results through November 21, 2011 (PDF) (13 pp, 307 K)
Lab-Validated Air Sampling Results through October 7, 2011 (PDF) (11 pp, 292 K)
Key to Air Monitoring Results - What the Data Meant
| AQI Values | CONTAMINANT RESULT / STATUS | CONTAMINANT CONCENTRATION | WHAT HAPPENS NEXT | WHAT YOU SHOULD DO |
|---|---|---|---|---|
| Good | Particulate Matter are either not detected or below project specific action levels. | <100 ug/m3 | Work continues as anticipated. | No additional protective action necessary. |
| Moderate | The PM levels were below EPA's NAAQs* but above more stringent project specific action levels. | 100- 149 ug/m3 | Work crews at the site increased dust suppression and control measures to address site specific dust to ensure that work could continue. | No additional protective action necessary. Note: project action levels trigger additional dust controls well before air quality conditions become unhealthy to those working and living near the project. |
| Unhealthy for Sensitive Groups | The PM levels were above EPA's NAAQs* for Air Quality | >150 ug/m3 | Work at the site may have been suspended to identify and control site-specific dust before work continued. | No additional protective action necessary. Note: elevated concentrations of PM may be the result of sources unrelated to the work at Aerovox. See EPA's Air Quality Index (AQI) data for area-specific information. |
| Unhealthy | Emergency at the site or PM levels above OSHA's permissible exposure limits (PEL)** | > 500 ug/m3 or Site Emergency | Work stops. Officials will work with residents/property owner(s) to either evacuate or stay in place until the situation is controlled. | Stay away from the Aerovox Site. If you live nearby shut your windows and listen to emergency officials for possible evacuation instructions. |
|
*NAAQS = National Ambient Air Quality Standards are based on risk to human health. The NAAQ for particulate matter (PM) is 150 ug/m3 which indicates unhealthy air quality. The unit measurements are micrograms per cubic meter ug/m3. Particulate Matter (PM), for this chart, means project-related dust may include site contaminants. What do the contaminant concentrations mean? The project-specific action level for PM is based on a more conservative 10 hr. time weighted average whereas EPA's NAAQ for particulate matter is based on a 24-hr. time-weighted average. EPA is using extremely low levels to trigger additional action to prevent exposure. The action levels assume that the dust detected from the project is transporting the additional contaminants such as PCBs that cannot be detected as easily and immediately. **In this scenario, the number assumes that PCBs are the only contaminant in the PM and the levels are above the OSHA permissible exposure limit (PEL) for worker safety. |
||||
Demolition Phases of Work
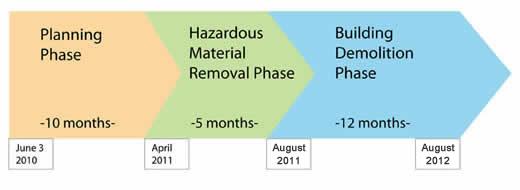 *Does not reflect the actual timeline, the demolition was completed ahead of the original, anticipated schedule.
It will be difficult to see the early progress as work takes place inside the building. Work crews must first remove interior material and debris and safely decommission utilities which will take several months to complete. Dismantling of the exterior structure of the building is expected to begin fall of 2011.
- Rigorous air and water quality monitoring and stormwater management will take place (from runoff collected from rainfall and dust suppression). EPA oversight of the data collection and validation will ensure that the project is progressing safely.
- Strict air and water quality standards will be used to compare with the collected data results. Background, or currently existing, air quality measurements will be recorded prior to the start of on-site work to verify that environmental conditions are not been impacted by the demolition.
- Data results will be made available to the public as soon as they are available. EPA will post summaries of the data here.
- Real-time air quality monitors will be operating at the site to ensure worker safety and alert work crews to the presence of dust that could carry airborne contaminants. In such an event, work would stop until the source is identified and controlled, if site-related. EPA will report daily on these results here.
All exterior and interior building material and debris will be disposed off-site at appropriately licensed landfills; the building foundation will remain on-site under a protective cap. Once the demolition and capping work is completed, the State Chapter 21-E cleanup program begins.
Other Relevant Documents
- An Ecological History of New Bedford Harbor 2011 (PDF) (61 pp, 4.6 MB)