Frequent Questions
Is the ROE a report card on the environment?
The ROE is not a “report card” on the state of the environment. Rather, it uses indicators to address specific questions about trends in the environment and human exposure and health.
Is the ROE an assessment?
The ROE is not an assessment. Many other environmental reports, particularly those that focus on specific issues or locations, conduct integrated assessments by gathering and weighing the strengths and weaknesses of all the relevant information available. The ROE intentionally focuses only on indicators, and thus by definition is not an assessment. The trends provided in the ROE may be used by others as part of an assessment.
How are ROE questions developed?
ROE questions are those that EPA believes should be answered with confidence for the Agency to be adequately informed about important environmental trends, but they are not necessarily questions that EPA can fully answer at present.
To develop ROE questions, EPA convenes scientists and other specialists from across the Agency to identify questions of importance to EPA's mission. ROE questions are posed without regard to whether national indicators are available to answer them. Questions (and the indicators developed to support them) may be added or modified over time to reflect changes in EPA priorities.
How are ROE indicators selected?
Once an ROE question is developed, EPA determines what indicators are suitable to help answer the question, and what data are available to develop these indicators. Some ROE indicators help to answer more than one question.
To identify potential indicators, EPA solicits suggestions from EPA specialists, other federal agencies, state agencies, non-governmental organizations, and academic experts. EPA then screens the candidate indicators against the indicator definition and criteria, and develops the most needed indicators when suitable data are available. Draft indicators are peer-reviewed by scientists outside the Agency before being added to the ROE.
Though the ROE presents many indicators, additional indicators are needed to more fully address the ROE questions. For one question (Recreational Waters) no indicators are presented in the current ROE because statistically valid and representative data from EPA surveys only recently became available. EPA works with federal, state, and nongovernmental organizations to identify potential new indicators and data on an ongoing basis.
Has the ROE been scientifically reviewed?
Yes. All ROE indicators are externally peer-reviewed by experts in relevant scientific fields to ensure that they meet the ROE indicator definition and criteria, are useful for answering the ROE questions, and are properly documented and scientifically sound. Only indicators that pass this review are included in the ROE. In addition, the entire report is reviewed periodically by EPA's Science Advisory Board (SAB). See Peer Review and Science Advisory Board (SAB) Reports for more information about these reviews and their findings.
Where do the ROE indicator data come from?
The underlying data for the ROE indicators were collected and compiled by a variety of federal and state agencies, including EPA, USGS, NOAA, and NASA, and non-governmental organizations, such as NatureServe. Each indicator includes a “Data Sources” section describing the source(s) of the indicator data.
What technical documentation is provided for ROE indicators? How can I access this documentation?
For each indicator, you can click on the “View Technical Documentation” link toward the bottom of the indicator page to view a technical documentation form describing:
- Data sources and availability.
- Methodology underlying the indicator, including data collection, indicator derivation, and quality assurance/quality control procedures.
- Analysis, including reference points, comparability over space and time, sources of uncertainty and variability, and information on statistical/trend analysis.
- Data limitations.
- References.
What statistical information is presented for ROE indicators?
The ROE displays confidence intervals (in the form of error bars or bands) and trend lines for trends that are statistically significant. These displays are provided as optional overlays to indicator graphics when such data are readily available and straightforward to add to the graph. Currently, the ROE displays confidence intervals for ten indicators and trend lines for one indicator.
The presence of the statistical information button ![]() to the right of a graph signals the availability of confidence intervals or trend lines that can be added to the display. Click on this button to view the available statistical information.
to the right of a graph signals the availability of confidence intervals or trend lines that can be added to the display. Click on this button to view the available statistical information.
Additional details about uncertainty, variability, and statistical analysis (for example, analysis of trends over time) can be found in the technical documentation for each indicator. A footnote beneath every ROE exhibit explains what is known about any trends in the data over time, if applicable. Note that the ROE considers trends to be statistically significant if they reach a level of confidence that is generally viewed as appropriate for the topic at hand. In most cases, the threshold is 95 percent confidence.
For more information, see What trend information does the ROE present?
What are confidence intervals? Why are they provided for ROE indicators (when available)?
ROE indicators are based on measurements of environmental and human health data. The possibility of errors in sampling, measurement, and/or reporting processes, as well as random variation associated with the underlying activity being measured, can introduce uncertainties into environmental measurement data. In other words, the actual value in the environment may be more or less than the measured value.
When sufficient information is available, statisticians can quantify the degree of uncertainty associated with measured values as a confidence interval. The key elements of a confidence interval are the confidence limits, or boundary values of the interval, and the associated probability that the actual value is contained in that interval.
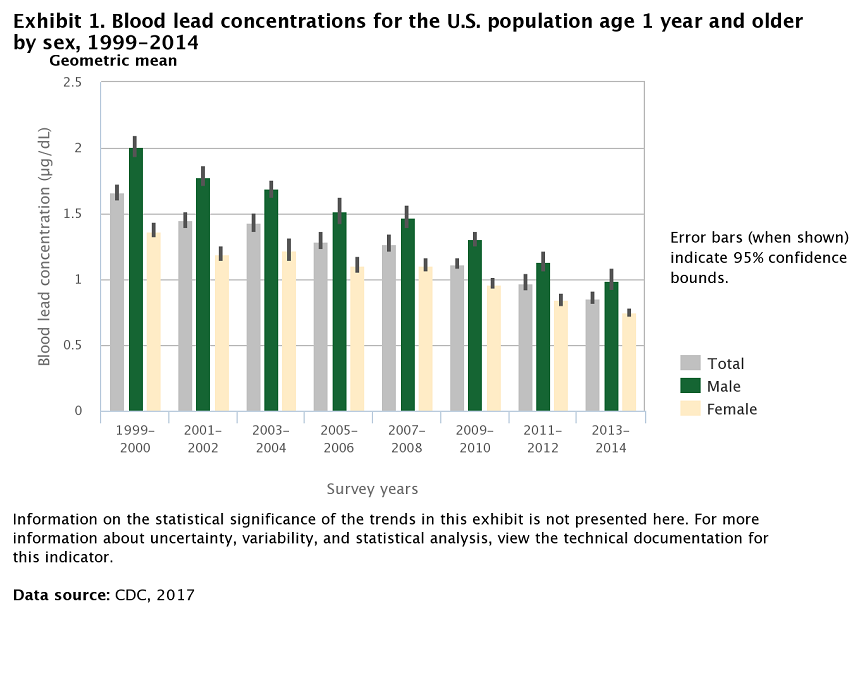
For example, when one refers to a 95 percent confidence interval, it means there is a 95 percent probability that the actual value falls within the range of the confidence interval. For ROE indicators, confidence intervals are displayed visually in the form of error bars on a bar graph or a shaded band on a line graph, as shown in the examples below.
- Error bars. Error bars show the upper and lower bounds for each data point expressed as a confidence bound or standard deviation. In the Blood Lead Concentrations exhibit shown below, the error bars show the range associated with the 95 percent confidence interval. This means there is a 95 percent probability that the true (i.e., actual) measurement value lies somewhere within the range bounded by the error bars.
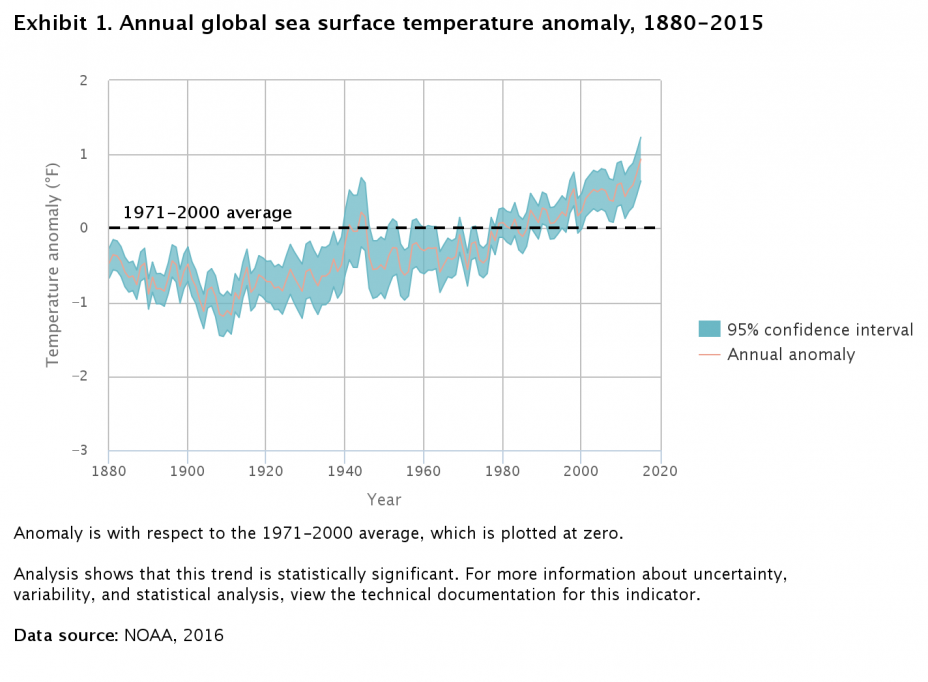
- Confidence bands. Other indicators, such as Sea Surface Temperature shown below, use a confidence band to display the confidence interval. A confidence band represents the uncertainty associated with a curve or function estimate. Like the error bars, the confidence band shows the range associated with the 95 percent confidence interval, meaning there is a 95 percent probability that the true value for each year lies somewhere within the range of the band.
What trend information does the ROE present?
Data presented over time, as in many of the ROE indicators, are referred to as a time series. A time series may look like it is increasing or decreasing over time, but statistical techniques are needed to calculate the slope of this trend and determine whether it truly represents an increase or decrease. These techniques are called trend analysis.
A footnote beneath every ROE exhibit explains what is known about any trends in the data over time, if applicable. See the footnote beneath the Sea Surface Temperature exhibit above for an example.
Trends are often calculated using ordinary least squares regression, which involves finding the straight line that best fits the shape of the time series. This line may slope upward, slope downward, or remain nearly flat. The slope of this line represents the slope of the trend over time. It can also be thought of as the average rate of change (for example, temperature may increase at an average rate of 0.013°F per year).
The next step in trend analysis is to determine whether the trend is statistically significant. Just as a measured value may differ from the actual value because of various forms of error, the calculated slope may differ from the actual trend because of factors such as variability in the data or a limited number of observations. Statistical significance refers to the likelihood that the actual slope is in the same direction as the calculated slope. Significance is expressed in terms of a percentage.
For example, if an increasing trend is said to be “significant to a 95 percent level,” that means there is at least a 95 percent chance that the actual trend is an increase. In general, the steeper the slope, the more data points available, and the less variability they show from year to year, the more likely it is that a trend will be statistically significant.
In contrast, a trend is more likely to be insignificant if the calculated trend is close to zero, if there is a lot of year-to-year variation in the data, or if there are so few data points that it is difficult to feel confident about the trend.
The ROE considers trends to be statistically significant if they reach a level of confidence that is generally viewed as appropriate for the topic at hand. In most cases, the threshold is 95 percent confidence. Where feasible, trend lines may be displayed in ROE exhibits for trends that are statistically significant.
Currently, the ROE displays trend lines for one indicator: Temperature and Precipitation. Click on the statistical information button to the right of each exhibit to view these statistically significant trends. To see the slope of the trend, view the legend or the tooltip that appears when hovering over the line. The technical documentation describes how each trend was calculated and provides the p-value, which indicates the level of significance. In a few cases, the technical documentation may explain that a trend was calculated but determined to be insignificant, in which case no trend line is shown on the graph.
Trend analysis in the ROE has several key limitations:
- Many ROE indicators do not yet have enough data points over time to support trend analysis.
- Trend analysis cannot explain underlying processes or provide any information on why a particular trend is observed.
- At present, most of the ROE trend analysis is restricted to the most common type of analysis: ordinary least squares. Other more sophisticated forms of analysis are available, including techniques that consider serial correlation. Serial correlation analysis of trends in ROE indicators may be presented in the future.
What other information does the ROE present relevant to indicator uncertainty or limitations?
For all ROE indicators:
- The indicator text describes the indicator's limitations.
- The indicator's technical documentation provides an overview of sources of uncertainty and variability, as well as information on statistical/trend analysis (when available).
How do the ROE indicators relate to other scientific indicator reports by EPA?
In addition to the ROE, EPA publishes other sets of indicators to report on specific issues of concern, such as climate change, environmental conditions in the U.S./Mexico border region, and children's health and the environment. While these other EPA products may share some indicators in common with the ROE, they also provide additional indicators beyond what appears in the ROE.
Many of these additional indicators are of the same high quality as the indicators in the ROE, and they have not been included in the ROE simply because the ROE aims for a wide breadth of topics rather than deep coverage of a single topic. These additional indicator compilations are frequently mentioned in the “Related Links” and “For More Information” areas of the ROE Web pages. EPA encourages readers to explore these additional indicators to learn more about specific topics of interest.