Modeling Water Releases in RSEI
EPA's Risk-Screening Environmental Indicators (RSEI) model calculates results for the following kinds of water releases reported to the TRI program:
- Direct water releases from reporting facilities.
- Transfers to wastewater treatment plants (Publicly Owned Treatment Works, or POTWs). Some portion of each transfer from a facility to a POTW remains in the water after treatment and is released as a water discharge.
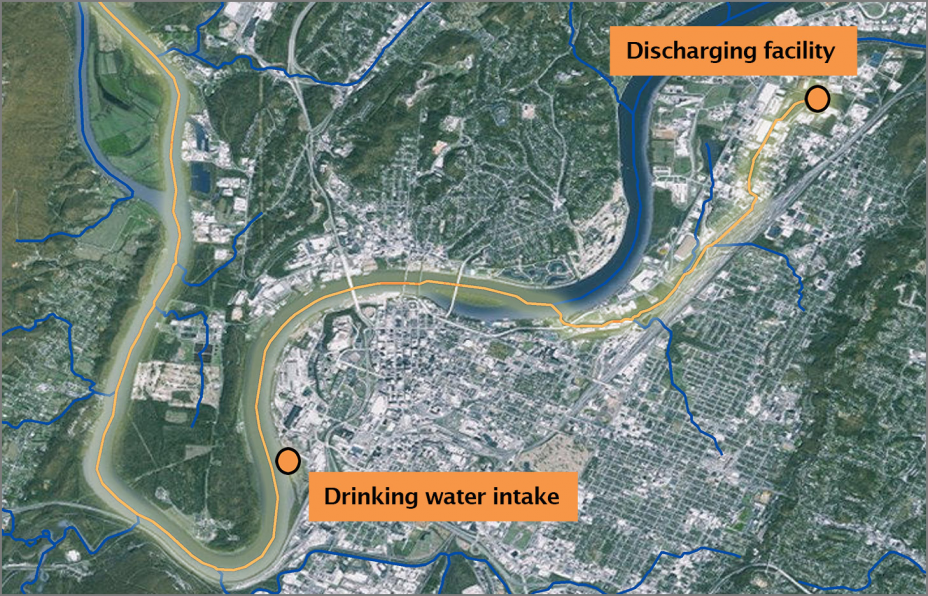
Water releases account for a much smaller percentage of total pounds and total RSEI Score than air releases. RSEI models potential exposure to chemicals released into surface water in one of two ways: by drinking tap water from a public water system whose water intake was located in the stream path of a chemical release; or by eating contaminated fish caught in a water body in the stream path of a chemical release.
 RSEI uses the following data to model water releases:
- Stream geography and hydrography (flow and volume estimates) from NHDPlus (based on the National Hydrography Dataset (NHD)).
- Stream segment that receives the facility’s or POTW’s chemical discharge.
- Chemical-specific water decay rate.
- Chemical-specific bioconcentration factor (BCF).
- Chemical-specific overall removal rate for POTWs.
- U.S. decennial census data.
- Age- and sex-specific body weights, drinking water ingestion rates, and fishing ingestion rates.
- EPA’s Maximum Contaminant Levels (MCLs) for chemical concentrations in drinking water systems.
- Drinking water intake locations.
- Number of people served by each drinking water system.
- Number of people by county (or by state if county data are unavailable) with fishing licenses.
RSEI does not include specific data on the following components related to water modeling:
- How the release rate of the chemical varies over time (RSEI assumes a constant rate of release).
- How other biological processes in streams (like sedimentation or biodegradation) affect the chemical concentration in the water (RSEI only models dilution and decay).
- What chemicals are produced from decay or transformation of modeled chemicals (RSEI only models the chemical released).
- How fish consumption rates vary geographically (RSEI uses nationwide values from an EPA survey, and assumes a fixed proportion of subsistence fishers with a higher ingestion rate than recreational fishers).
- How many people fish in a given stream (RSEI assumes a portion of the population within 50 miles, based on available fishing license data).
- What portion of the drinking water system is supplied from any given intake (RSEI assumes any intake supplies the whole system).
- Where the people served by a drinking water system live (RSEI makes no assumption in this regard).
- How a facility distributes its discharges across discharge pipes (RSEI assigns one discharge point per facility).
- What specific technologies are used by POTWs (RSEI assumes only secondary treatment at all POTWs).
For each stream segment downstream from a facility discharging to water, RSEI calculates the following metrics:
- Population (number of people in grid cell).
- Chemical concentration.
- Toxicity-weighted concentration (toxicity weight x concentration), provided in the RSEI Geographic Microdata
- Estimated dose. Human exposure assumptions (body weight, fish ingestion rate and drinking water ingestion rate) are used to transform the concentration into an estimated dose for each stream segment.
- RSEI Score (dose x toxicity weight x population).
Section 5 of the RSEI methodology document provides detailed information on how RSEI models water releases.
