RSEI Geographic Microdata (RSEI-GM)
On this page:
- How are the RSEI Geographic Microdata different from the data in EasyRSEI?
- Microdata results
- Working with the Microdata grid cells
- Water Microdata
- Get the Microdata
The Geographic Microdata from EPA's Risk-Screening Environmental Indicators (RSEI) model are a unique dataset that provides detailed air model results at the grid-cell level. While the variations in impact around a facility are provided at a very granular level, they are estimates based on computer modeling, and cannot be used to determine the actual risk or exposure at any given point around a facility. RSEI Geographic Microdata, like the RSEI facility-level data, should only be used for screening-level comparisons and trends.
The RSEI air modeling page contains more information on how RSEI calculates air concentrations.
How are the RSEI Geographic Microdata different from the data in EasyRSEI?
The RSEI Microdata are part of the same suite of results that are used for EasyRSEI. In order to make the data small enough to work with in a desktop database application, EasyRSEI adds up potential impacts to the facility/release level. This level of aggregation is convenient and appropriate for looking at rankings and trends for facilities, industries, and larger geographic areas. However, when looking at a small geographic area, the EasyRSEI facility-level results are based on releases originating from any facilities in that area, even if the release occurs at an off-site incineration facility in a different geographic area.
 In contrast, the Microdata are not aggregated by facility or release, but include values for each release and each potentially impacted grid cell. So when looking at a small geographic area, you can sum up the potential impacts over the affected grid cells, regardless of where the releases originate, and get a more realistic picture of the degree to which the area is potentially affected by TRI releases. Using the Microdata, you can trace back the potential impacts from the grid cells to the facility that released the chemical(s).
Microdata results
The Microdata contains several metrics for users. For each impacted grid cell, the Microdata files provide chemical concentration, toxicity-weighted concentration, RSEI Score and population. The files also contain index fields that link to the RSEI facility, chemical, and off-site tables, so users can easily link to that information.
RSEI also provides aggregated Microdata files, which sum up all releases for each grid cell by toxicity-weighted concentration and RSEI Score.
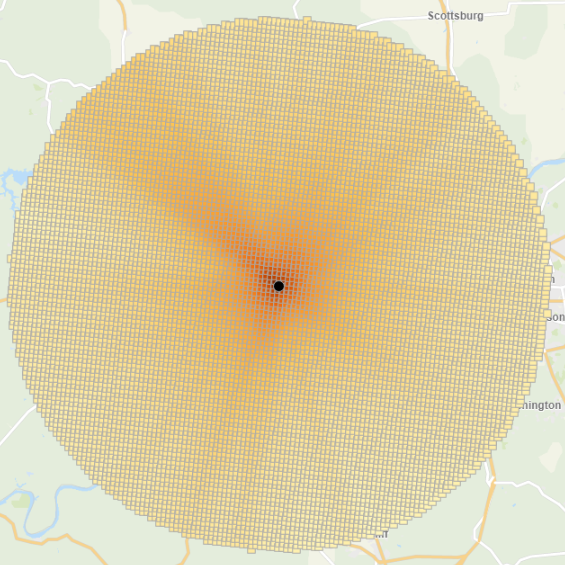
Working with the Microdata grid cells
RSEI uses a geographic system that describes the United States and its territories as a series of grids made up of 810 meter by 810 meter grid cells. For each cell in the grid, a grid address in terms of grid and (x,y) coordinates is assigned based on latitude and longitude. Each facility is also assigned a grid address. Grid shapefiles are provided on the RSEI ftp site. Exit
RSEI grid and locational information contains more information the RSEI grid system.
Water Microdata
RSEI water microdata are produced at a different level than the air microdata. Instead of the grid cell, the water microdata use the stream segment as the unit of analysis. Before using the water microdata, users should familiarize themselves with the how RSEI models water releases and be aware that TRI does not include all of the chemical discharges to water from industrial facilities.
Get the Microdata
The Microdata are posted in various formats on several different public websites for free download. For RSEI Version 2.3.9, the last three data years (2016-2019) are available. An expanded set of microdata is available for 2018, including all data years (1988-2018) at different geographical scales (census tract, block group, ZIP code, grid cell). Details on getting the Microdata.