About the Health of the Salish Sea Report
- Background
- How to use this report
- Causal framework
- Traditional and local knowledge
- About the data
- Related information
Background
In 2000, EPA and Environment Canada (now Environment and Climate Change Canada) agreed to work together to address cross-border environmental issues facing the Georgia Basin-Puget Sound marine ecosystem, known as the Salish Sea. This agreement required our two agencies to develop action plans and report to the public on the health of our common ecosystem.
Our first report was published in 2002, followed by a second report in 2005. This website represents the current version of our report. It will be updated periodically to reflect new information and data.
There is some intentional overlap of information between this report and other reports that are available - most notably the Puget Sound Partnership's Vital Signs.Exit
However, this report is unique in its focus on the entire Salish Sea ecosystem with an emphasis on collaboration across the U.S.-Canada international border, and across various levels of government, non-profits, First Nations and tribes.
How to Use this Report
Just as doctors use blood pressure to learn about a person's overall health, scientists can learn about an ecosystem's overall health by studying certain plants, animals, and other environmental measures.
In this report we study trends for 10 environmental indicators (e.g. air quality, chinook salmon) that help give us a better picture of the current environmental, economic, and social well-being of our Salish Sea watershed.
You don't need to read the indicator summaries in any particular order. No single indicator is representative of all that's happening, but as you read about each one you'll begin to understand how they're connected.
Legend


We've assigned a green, red, or yellow icon (see legend) to each indicator that lets you know whether the overall status is improving, declining, or neutral (unchanged).
Our findings for each indicator address the following questions:
- What's happening?
- Why is it important?
- Why is it happening?
- What are we doing about it?
You will also see tips for what you can do to help, links for related information, and scientific references used to support our findings.
Our findings will be updated periodically.
Causal Framework

A causal chain analysis is a scientific approach for linking the cause of a problem with its effects.
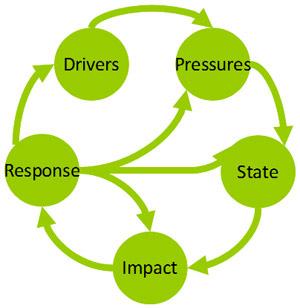
This report uses a framework called Drivers-Pressures-State-Impacts-Response (or DPSIR) to define the causal links between human activities (drivers) and the stress or pressure they can put on the ecosystem, changes in the state of the ecosystem, and impacts to the ecosystem.
- Drivers = social, demographic and economic forces
- Pressures = human activities
- State = measured conditions, trends
- Impacts = significance
- Responses = actions, decisions, adaptations
Society can then respond with management actions that regulate the driver, pressure, state, or impact.
Indicators used in this report were selected based on criteria to ensure scientific validity, practicality, reliability and relevance to regional ecosystem goals. Preference was given to transboundary indicators that were included in our previous reports, as well as those compatible with indicators reported through the Puget Sound Partnership's Vital Signs.
Traditional and Local Knowledge
Throughout this report you will see sections that highlight "sustainable perspectives." These sections refer to traditional and local ecological knowledge which is built over generations as people learn from the land and sea they depend on for their food, materials and culture, and directly interact with the ecosystem over a long time.
While the scientific perspective may be different from the traditional perspective, both have a great deal to offer one another. Working together is the best way of helping us achieve a better common understanding of nature.
Traditional knowledge:
- Increases the timeline of available information.
- Provides a more holistic view of ecosystem interactions.
- Helps answer the question, "Why is it important?"
About the Data
This report updates previous Puget Sound-Georgia Basin ecosystem indicator reports (in 2002 and 2005) and expands the suite of information to increase their relevance to ecosystem health, including human well-being.
A number of current publications report on environmental conditions in the Salish Sea. This report draws on existing publicly-available information, including agency technical reports, scientific sampling from Canadian and U.S. sources, and scientific work by non-governmental organizations.
