Stream Flow
Summary
Declining
10 of the 17 rivers we studied showed decreasing summer flow trends since 1975. Five of the remaining seven rivers showed only minor increases or decreases in flow.
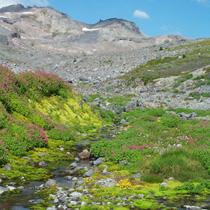
The Salish Sea is an ecosystem defined by the movement of water. Freshwater begins as rain or snow in the Cascade and Olympic mountains. It flows in streams down through fertile valleys and into a complex network of salt marshes, wetlands, and bays.
Low flow in our streams and rivers occurs during summer months when there is less rain and warmer temperatures, and the snow-pack has been depleted.
These low summer flows can affect salmon runs, wildlife, and our residential, agricultural and industrial water supplies.
- Learn how we measure low flows
Summer low flow is calculated as the minimum 30-day average water flow measured each year at river and stream gauging stations.
We studied data collected since 1975 to determine whether the long-term trends of annual summer low flow levels are declining or increasing in unregulated rivers. Unregulated rivers are those without major dams or man-made reservoirs and are most sensitive to climate and land-use changes.
What's happening?
Since 1975, 10 of the 17 rivers we studied showed strongly significant decreasing summer flow trends. Five of the remaining seven rivers showed weaker increasing or decreasing in flow over the 35 year study period (see chart below).

The remaining two rivers that showed strongly increasing flow trends (Puyallup and Dungeness) have upper tributaries that are fed by glaciers or snow fields high in the mountains. The increased flow in these rivers may be due to glacial melting and recession.
Also, the most recent low flow seasons have been associated with "La Niña" weather conditions resulting in two of the highest flows on record, which may have tipped some of the trends toward increasing.
Why is it important?
If summer flows continue to decline as demand for water continues to increase for uses such as drinking water and irrigation, there is potential for conflict between human and ecosystem needs. Low water flow is already a priority issue for salmon in 14 of the 19 Puget Sound Water Resource Inventory Areas.
Changes in stream flow are associated with shifts in salmon habitat, water temperature, nutrient availability, and sediment levels. These changes can impact both human uses and the life cycles of salmon and other aquatic life.
Why is it happening?
Rainfall and snowmelt are the primary sources of water for rivers and streams in the Salish Sea, but many other factors can also impact stream flows, including:
- Dams and other hydrological modifications.
- Loss and change of vegetative cover.
- Surface and ground water withdrawals for municipal, domestic, commercial, industrial, and agricultural water supplies.
- Wells that tap ground water.
- Over-allocation of water rights.
- New buildings, roads, and parking lots that prevent water from percolating into the ground and slowly recharging streams throughout the summer.
Climate can also affect trends. However, declining flow trends in the Salish Sea are more likely associated with human-caused watershed impacts since recent climate patterns (including trends in the Pacific Decadal Oscillation and two strong La Niña years) would be expected to increase stream flows rather than decrease flows.
- Learn more about why it's happening
Climate models suggest that over the next four decades, rain water runoff will become more important than snowmelt for recharging our freshwater streams in mountainous watersheds like those surrounding the Salish Sea. Higher temperatures will shorten the overall snowfall season and accelerate the rate of spring snowmelt, leading to earlier, greater, and more rapid late fall and early spring runoff and lower summer flows.
Assessments by the University of Washington’s Climate Impacts Group suggest that climate change pressures in Puget Sound are likely to include:
- Changes in streamflow timing and volume. Watersheds with streamflow based mostly or partially on snowmelt are projected to have the greatest hydrological shifts associated with climate change.
- Temperature changes. During the last century, average air temperature in the Puget Sound region increased 2.3°F. Average annual temperature in the Pacific Northwest is projected to increase by about 2°F by the 2020s, 3.2°F by the 2040s and 5.3°F by the 2080s (relative to the period from 1970-1999). Most models also project wetter winters and drier summers.
- Loss of snowpack and glacial retreat. The loss of snowpack and glacial retreat are one of the most far-reaching impacts of rising temperature. It affects water availability for both people and wildlife. Under a moderate warming scenario (the A1B greenhouse emissions scenario), average spring snowpack in Washington is projected to decrease 29% by the 2020s, 44% by the 2040s, and 65% by the 2080s (relative to the average for 1916-2006).
Primary Sources of Water for Salish Sea Rivers
River Primary Source Chehalis R. near Harrison Mills, B.C. Rain-fed Chemainus R. Westholme, B.C. Rain-fed Deschutes R. near Rainier, WA Rain-fed Issaquah Creek near Issaquah, WA Rain-fed Koksilah R. at Cowichan Station, B.C. Rain-fed San Juan R. near Port Renfrew, B.C. Rain-fed Sumas R. near Huntingdon, B.C. Rain-fed Chilliwack R. at Vedder Crossing, B.C. Rain and snow-fed Nooksack R. at Ferndale, WA Rain and snow-fed (Mt. Baker) North Fork Stillaguamish R. near Arlington, WA Rain and snow-fed (Cascades) Puyallup R. near Orting, WA Rain and snow-fed (Mt. Rainier) Slesse Creek near Vedder Crossing, B.C. Rain and snow-fed Snohomish R. near Monroe, WA Rain and snow-fed (Cascades) Dungeness R. near Sequim, WA Snow-fed (Olympics) Lillooet R. near Pemberton, B.C. Snow-fed (Lillooet Icecap) Nahatlatch R. below Tachewana Creek, B.C. Snow-fed (Nahatlatch Glacier) Oyster R. below Woodhus Creek, B.C. Snow-fed (Comox Glacier)
What are we doing about it?
Streams and rivers are being closely monitored to help forecast low flow conditions. Actions that are already underway in both Canada and the U.S. that will help address this complex issue include water conservation programs, promoting sustainable development, and long range planning.
- Learn more about what we're doing
Below are some examples of projects that are being implemented to help address decreasing stream flows.
Georgia Basin
- Improve long term projections and planning. Actions by Environment Canada have focused on monitoring, modeling and research to support long term planning and management for low stream flows.
- Modernize water laws. As one of the commitments under its Living Water Smart plan, the British Columbia Ministry of Environment is in the process of modernizing its water laws to address stream flow needs for competing uses and to protect groundwater.
- Monitor flow conditions. The British Columbia Ministry of Forests, Lands and Natural Resource Operations operates the River Forecast Centre which interprets streamflow data along with snow and meteorological data from other agencies.
- Promote sustainable development. Regional governments such as the Capital Regional District, MetroVancouver and the Fraser Valley Regional District and their member cities are developing long range growth plans (called Official Community Plans) to help ensure we'll be able to meet future water use needs. For example, the City of Surrey has a plan to maintain base stream flows and natural water flow patterns to protect aquatic animals and avoid flood damage.
Puget Sound
As a result of flow monitoring in rivers in the Puget Sound basin, the following general river management objectives have been identified:
- Maintain flows in unregulated rivers that currently are most stable: Puyallup, Dungeness, Nooksack
- Restore low flows to bring the Snohomish River from a weakly decreasing trend to a neutral trend
- Restore low flows to bring the Deschutes River, North Fork Stillaguamish River, and Issaquah Creek from a strongly decreasing trend to a weakly decreasing trend
Agencies are using the following approaches to help achieve the objectives outlined above:
- Establish and update instream flow rules and manage future water withdrawals from rivers and streams. The term “instream flow” is used to identify a specific stream flow (typically measured in cubic feet per second, or cfs) at specific locations for defined time periods. Instream flows are usually defined as the stream flows needed to protect and preserve instream resources and values, such as fish, wildlife, water quality, aesthetics, and recreation. Indirectly, instream flow rules can also help us know where to target flow restoration projects, like conservation. The Washington State Department of Ecology has adopted rules protecting stream flows in 13 out of 18 Puget Sound watersheds.
- Decrease water use. Managing demand and promoting conservation will be critical as population increases. The near-term objectives for water demand and water conservation address four key sectors: municipalities, agriculture, industry, and rural domestic water users. Demand and conservation goals will be met through a combination of implementation and enforcement of rules, voluntary participation in conservation programs, market-based approaches to adjust water usage, and current and emerging water conservation technologies.
- Improve groundwater management. A critical approach to protection and restoration of freshwater resources includes management of groundwater in conjunction with surface water to better account for the interaction between the two.
- Promote reclaimed water projects. Reclaimed water comes from domestic wastewater and small amounts of industrial process water or stormwater. The process of reclaiming water - sometimes called water recycling or water reuse - involves a treatment process that speeds up nature's restoration of water quality. The process provides a high level of disinfection to assure that water meets stringent requirements. Reclaimed water can be used for irrigation, industrial processes, toilet flushing, dust control, construction activities, and many other non-potable uses. Reclaimed water also can be used as resource to create, restore, and enhance wetlands, recharge groundwater supplies, and increase the flows in rivers and streams.
Five things you can do to help
- Fix your leaks! An average home can waste more than 10,000 gallons of water every year due to running toilets, dripping faucets, and other household leaks. Visit EPA's Fix a Leak Week page for tips on where to look for leaks.
- Consider water efficiency next time you buy new products like washing machines, dishwashers, refrigerators, taps, and toilets.
- An average home devotes 30% of its daily water consumption to outdoor uses. Water your lawn deeply but infrequently – the rule of thumb is one inch per week. Find a certified irrigation professional to install, maintain, or audit your home's irrigation system to ensure it is watering at peak efficiency. Switching to drought tolerant grasses or letting the lawn go dormant during the summer can also save significant amounts of water.
- Use techniques such as natural landscaping, rain gardens, rain barrels, green roofs and permeable paving that conserve water and allow rain to soak into the ground.
- Since agriculture has the highest water use, communities and local governments can encourage efficient water use for both individual gardens and larger farms.
Learn more about this topic
The following links exit the site Exit
- U.S. Geological Survey Water Data for Washington
- Washington Dept. of Ecology river and stream monitoring
- Puget Sound Partnership Vital Signs
- Northwest Indian Fisheries Commission State of Our Watersheds
- Canada Real-time Hydrometric Data
- British Columbia River Forecast Centre
- British Columbia Living Water Smart
Scientific references
The following links exit the site Exit
- Snover, A.K., P.W. Mote, L.C. Whitely Binder, A.F. Hamlet, and N.J. Mantua. 2005. Uncertain Future: Climate Change and Its Effects on Puget Sound (PDF) (37pp, 4.6MB). Climate Impacts Group, Center for Science in the Earth System, Joint Institute for the Study of the Atmosphere and Oceans, University of Washington.
- Snover, A.K., P.W. Mote, L.C. Whitely Binder, A.F. Hamlet, and N.J. Mantua. 2005. Uncertain Future: Climate Change and Its Effects on Puget Sound. Climate Impacts Group, Center for Science in the Earth System, Joint Institute for the Study of the Atmosphere and Oceans, University of Washington.
- Mote, P.W., and E.P. Salathé. 2010. Future climate in the Pacific Northwest. Climatic Change 102(1-2): 29-50, doi: 10.1007/s10584-010-9848-z.
- Elsner, M.M., L. Cuo, N. Voisin, J. Deems, A.F. Hamlet, J.A. Vano, K.E.B. Mickelson, S.Y. Lee, and D.P. Lettenmaier. 2010. Implications of 21st century climate change for the hydrology of Washington State. Climatic Change 102(1-2): 225-260, doi: 10.1007/s10584-010-9855-0.
- Mote, P.W., A. Petersen, S. Reeder, H. Shipman, and L.C. Whitely Binder. 2008. Sea Level Rise in the Coastal Waters of Washington State. Report prepared by the Climate Impacts Group, Center for Science in the Earth System, Joint Institute for the Study of the Atmosphere and Oceans, University of Washington, Seattle, Washington and the Washington Department of Ecology, Lacey, Washington.
- More references
- Allen, D. M.; Whitfield, P. H.; Werner, A. (2010): Groundwater level responses in temperate mountainous terrain: Regime classification, and linkages to climate and streamflow. In Hydrol. Processes 24 (23), pp. 3392–3412.
- Environment Canada. 2004. Threats to Water Availability in Canada. National Water Research Institute, Burlington, Ontario. NWRI Scientific Assessment Report Series No. 3 and ACSD Science Assessment Series No. 1. 128 p.
- Fleming, Sean W.; Whitfield, Paul H.; Moore, R. D.; Quilty, Edward J. (2007): Regime-dependent streamflow sensitivities to Pacific climate modes cross the Georgia–Puget transboundary ecoregion. In Hydrol. Process. 21 (24), pp. 3264–3287.
- Shrestha, R. R.; Schnorbus, M. A.; Werner, A. T.; Berland, A. J. (2012): Modelling spatial and temporal variability of hydrologic impacts of climate change in the Fraser River basin, British Columbia, Canada. In Hydrol. Processes 26 (12), pp. 1841–1861.
- Whitfield, P. H.; Reynolds, C. J.; Cannon, A. J. (2002): Modelling streamflow in present and future climates: Examples from the Georgia Basin, British Columbia. In Can Water Resour J 27 (4), pp. 427–456.
- Whitfield, P. H.; Wang, J. Y.; Cannon, A. J. (2003): Modelling Future Streamflow Extremes - Floods and Low Flows in Georgia Basin, British Columbia. In Can Water Resour J 28 (4), pp. 633–656.
- Fisheries and Oceans Canada. 1997. Wild, Threatened, Endangered and Lost Streams of the Lower Fraser Valley- Summary Report. Lower Fraser Valley Stream Review, Volume 3. ISBN 0-662-26029-5. Catalogue number FS23-304/8-1997E.
- Fisheries and Oceans Canada. 1999. Lower Fraser Valley Streams Strategic Review. Lower Fraser Valley Stream Review, Volume 1. ISBN 0-662-26167-4. Catalogue number Fs23-323/1-1997E.
- Helsel, D.R. and R.M. Hirsch, 1991. Techniques of Water-Resources Investigations Book 4, Chapter A3. U.S. Geological Survey, Reston, VA.
- Lins, H. F. and J.R. Slack, 1999. Streamflow Trends in the United States. Geophysical Research Letters, Vol. 26, No. 2, Pages 227-230, January 15, 1999. American Geophysical Union.