AVERT Tutorial: Getting Started – Identify Your AVERT Region(s)
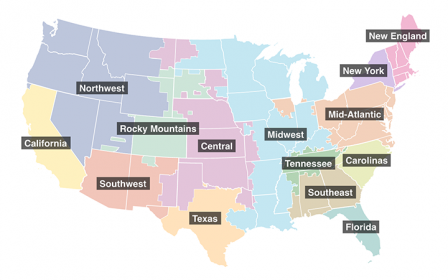
AVERT uses regional data files to estimate displaced emissions. The contiguous 48 states are split into 14 AVERT regions, which are aggregates of grid balancing authorities. A total of 24 states are split across AVERT boundaries—most across two regions, with the exception of Kentucky, Mississippi, Montana, New Mexico, and South Dakota, which are split across three AVERT regions, and Texas, which is split across four regions. Consult the map below to determine whether your state is split across AVERT boundaries.
 If you are using AVERT for a state that is split across AVERT boundaries, you might need to run AVERT more than once. For example, if you want to capture the impacts of a statewide EE/RE program in a state that is in multiple AVERT regions, apportion the EE/RE impact based on the proportion of generation in each region (found in the table above), run AVERT for each region, and aggregate the results. To see a demonstration of how this is done, skip ahead to Step 5: Run AVERT for Multiple Regions if Needed.
It is not always necessary to run AVERT more than once, even if your state falls into more than one AVERT region. In the following situations, states that are split across AVERT boundaries only need to run AVERT once:
- If you know the exact location of proposed or new EE/RE, and can readily place it all in one AVERT region, run an AVERT displacement calculation for that region only.
- If you want to capture the impacts of a statewide EE/RE program in a state where more than 95 percent of generation is encompassed by one AVERT region, EPA recommends that you only run AVERT for that region.
- You can also use the statewide analysis feature of the web-based version of the Main Module, which allows you to run a statewide energy program without having to perform multiple runs of the model.
For more information and examples, consult the AVERT User Manual.
The chart below gives each state’s apportionment by AVERT region.
State apportionment by AVERT region, based on electricity sales in 2018:
| State | California | Carolinas | Central | Florida | Mid-Atlantic | Midwest | New England | New York | Northwest | Rocky Mountains | Southeast | Southwest | Tennessee | Texas |
|---|---|---|---|---|---|---|---|---|---|---|---|---|---|---|
| Alabama | 74% | 26% | ||||||||||||
| Arizona | 100% | |||||||||||||
| Arkansas | 26% | 74% | ||||||||||||
| California | 100% | |||||||||||||
| Colorado | 100% | |||||||||||||
| Connecticut | 100% | |||||||||||||
| Delaware | 100% | |||||||||||||
| District of Columbia | 100% | |||||||||||||
| Florida | 94% | 6% | ||||||||||||
| Georgia | 98% | 2% | ||||||||||||
| Idaho | 100% | |||||||||||||
| Illinois | 65% | 35% | ||||||||||||
| Indiana | 21% | 79% | ||||||||||||
| Iowa | 6% | 94% | ||||||||||||
| Kansas | 100% | |||||||||||||
| Kentucky | 30% | 55% | 15% | |||||||||||
| Louisiana | 7% | 93% | ||||||||||||
| Maine | 100% | |||||||||||||
| Maryland | 100% | |||||||||||||
| Massachusetts | 100% | |||||||||||||
| Michigan | 4% | 96% | ||||||||||||
| Minnesota | 1% | 99% | ||||||||||||
| Mississippi | 44% | 23% | 32% | |||||||||||
| Missouri | 35% | 65% | ||||||||||||
| Montana | 7% | 91% | 2% | |||||||||||
| Nebraska | 96% | 4% | ||||||||||||
| Nevada | 100% | |||||||||||||
| New Hampshire | 100% | |||||||||||||
| New Jersey | 100% | |||||||||||||
| New Mexico | 35% | 5% | 60% | |||||||||||
| New York | 100% | |||||||||||||
| North Carolina | 96% | 4% | ||||||||||||
| North Dakota | 47% | 53% | ||||||||||||
| Ohio | 100% | |||||||||||||
| Oklahoma | 95% | 5% | ||||||||||||
| Oregon | 100% | |||||||||||||
| Pennsylvania | 100% | |||||||||||||
| Rhode Island | 100% | |||||||||||||
| South Carolina | 100% | |||||||||||||
| South Dakota | 50% | 25% | 25% | |||||||||||
| Tennessee | 2% | 98% | ||||||||||||
| Texas | 7% | 5% | 1% | 86% | ||||||||||
| Utah | 97% | 3% | ||||||||||||
| Vermont | 100% | |||||||||||||
| Virginia | 100% | |||||||||||||
| Washington | 100% | |||||||||||||
| West Virginia | 100% | |||||||||||||
| Wisconsin | 100% | |||||||||||||
| Wyoming | 62% | 38% |
![]()
![]()