AVoided Emissions and geneRation Tool (AVERT)
A tool that estimates the emissions benefits of energy efficiency and renewable energy policies and programs
On this page:
- Cost-effective ways to reduce air pollution and include emission benefits in Clean Air Act Plans
- What is AVERT?
- Why use AVERT?
- When should AVERT not be used?
- Who should use AVERT?
- How does AVERT work?
- How to run scenarios in AVERT
- Download AVERT
- What other tools are available?
Cost-effective ways to reduce air pollution and include emission benefits in Clean Air Act Plans
Many states and municipalities are adopting, implementing, and expanding cost-effective energy efficiency (EE) and renewable energy (RE) policies and programs. States are investing in EE/RE policies and programs to achieve benefits including lowered customer costs, improved electric supply reliability, and diversified energy supply portfolios. Energy efficiency and renewable energy also have the potential to reduce pollution of criteria air pollutants and greenhouse gases, especially on high electricity demand days that typically coincide with poor air quality.
Quantifying the emissions impacts of EE/RE policies and programs can be challenging. EPA is committed to helping state air quality planners calculate the emissions benefits of EE/RE policies and programs so that these emission reductions can be incorporated in Clean Air Act plans to meet National Ambient Air Quality Standards (NAAQS) and other clean air goals.
What is AVERT?
AVERT is a free tool with a simple user interface designed to meet the needs of state air quality planners and other interested stakeholders. Non-experts can use AVERT to evaluate county, state, and regional changes in emissions from electric power plants resulting from energy policies and programs such as EE and RE. AVERT is designed to use public data that are accessible and auditable.
Why use AVERT?
State air quality planners, energy office and public utility commission staff, and other organizations interested in knowing the emission impacts of energy policies and programs can use AVERT to:
- Quantify the particulate matter (PM2.5), nitrogen oxides (NOX), sulfur dioxide (SO2), and carbon dioxide (CO2) emissions benefits of state and multi-state EE/RE policies and programs.
- Examine the regional, state, and county level emission impacts of different EE/RE programs based on temporal energy savings and hourly generation profiles.
- Include AVERT-calculated emission impacts of EE/RE policies and programs in air quality modeling and Clean Air Act plans used to meet the National Ambient Air Quality Standards with the concurrence of the appropriate EPA regional office.
- Compare the emission impacts of different types of EE/RE programs, such as the emission impacts of wind installations versus solar installations.
- Understand the emission impacts of different EE/RE policies and programs during high electricity demand days.
- Analyze the emission benefits of EE/RE programs in multiple states within an AVERT region.
- Assess emission impacts from energy policies that increase electricity demand.
- Present information about location-specific emissions benefits in easy–to–interpret tables and maps.
Learn more:
- Fact Sheet for Decision Makers
- Avoided Emission Factors Generated from AVERT
- Link to AVERT Web Edition
When should AVERT not be used?
AVERT is only intended for analyzing the power sector emission impacts of energy policies and programs such as EE and RE. AVERT’s emission factors and web edition can be used as a screening analysis to help states get started with understanding the emission impacts of EE/RE policies and programs. AVERT’s Excel-based modules provide more functionality, but they should not be used to examine the emission impacts of major fleet adjustments. Users who wish to conduct analyses more than five years from the baseline must use AVERT’s statistical module and future year scenario template.
Who should use AVERT?
- Analysts who wish to improve their understanding of the emission benefits of statewide or multi-state EE/RE policies and programs.
- Environmental agency staff and state air quality planners interested in assessing emission benefits being incorporated into Clean Air Act plans to meet the National Ambient Air Quality Standards or other clean air goals.
- Energy office or public utility commission staff who want to estimate and promote the air quality benefits of their energy efficiency or renewable energy policies.
AVERT has been used in numerous reports and analyses, including more than a dozen peer-reviewed articles. View a summary of how AVERT has been used and cited.
How does AVERT work?
AVERT represents the dynamics of electricity dispatch based on the historical patterns of actual generation in one selected year. Currently, AVERT has data for 2007-2019.
- AVERT's Statistical Module uses hourly "prepackaged" data from EPA’s Air Markets Program Data (AMPD) and National Emissions Inventory to perform statistical analysis on actual behavior of past generation, heat input, PM2.5, SO2, NOx, and CO2 emissions data given various regional demand levels. (AVERT’s Statistical Module can also analyze user-modified data created in AVERT’s Excel-based Future-Year Scenario Template). AVERT’s Statistical Module produces regional data files that are input files used in AVERT’s Excel-based Main Module.
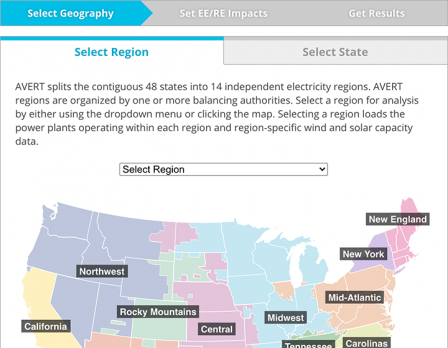
- AVERT’s Main Module prompts users to select one of 14 AVERT regional data files and enter energy impacts (MWh or MW) from a selection of options.
- The AVERT Main Module calculates emissions impacts based on the hourly electric generating unit information in the regional data files and the impacts entered into the tool.
- Use avoided emission factors generated from AVERT to quickly estimate the magnitude of emission impacts within an AVERT region for six categories: onshore wind energy, offshore wind energy, rooftop-scale photovoltaic installations, utility-scale photovoltaic installations, portfolio EE programs, and baseload EE programs.
How to run scenarios in AVERT
The AVERT Overview and Step-by-Step instructions provide an overview of how AVERT works, and step-by-step demonstrations of how to use AVERT.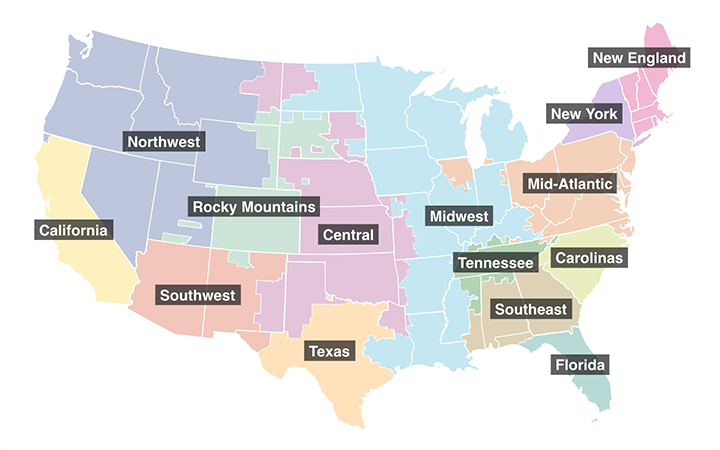 Note: AVERT does not currently model emissions scenarios for Alaska or Hawaii.
Two versions of the AVERT Main Module are available: a fully-featured Excel version and a streamlined web-based tool. The online tool provides similar functionality to the downloadable Excel tool, without the need to download any files or software. The online version relies on the most recent year of input data, creates commonly used output formats, and allows users to save results. It also can perform analyses for a selected state, including states that span more than one AVERT region. Some users will find that the web edition meets their needs, while others may prefer using the Excel version to access different data years, custom load profiles, future scenarios, and additional outputs.
AVERT’s Main Module estimates the changes in emissions likely to result from energy programs, policies, and projects in reference to a base-year or future-year scenario. Installation of AVERT’s Statistical Module and AVERT’s Future-Year Scenario Template is not necessary to use AVERT’s Main Module to estimate emissions impacts modeled in a historical base year. However, modeling emissions impacts with reference to user-created future years requires all three AVERT modules.
Users select one of 14 AVERT regions for analysis, upload one regional data file, and input data on the type of EE/RE program they want to analyze in AVERT. For EE policies and programs, users should have EE savings annual impacts (MWhs or MW) and an understanding of the policies’ or programs’ temporal profiles (e.g., would the EE program save energy during peak periods or the same amount through the year). For RE programs, users will need to know the total capacity of the solar or wind resource they are interested in analyzing.
Users will then run the model to calculate the changes in generation and emissions from the chosen scenario. The Excel-based calculation can take up to 10 minutes depending upon the region and computer capabilities.
The AVERT Main Module provides output in the form of county-level emissions and generation tables and charts for the user’s selected AVERT region. It also produces SMOKE-formatted data for advanced air modeling applications, as well as data that can be used with EPA’s COBRA tool to quantify and monetize public health impacts.
Learn more:
- AVERT Main Module Quick Start Guide
- AVERT User Manual
- The AVERT Overview and Step-by-Step instructions
Download AVERT
Please visit the AVERT Download Page for further details about how to download AVERT files.
In order to run AVERT’s Main Module, computers running Windows must have Excel 2007 or newer. The Main Module can also be used in Excel 2011 or newer for Mac. Macros must be enabled. Excel files generated in AVERT’s Main Module can exceed 100 MB in size, depending on the number of generating units in the region of analysis.
Access a web-based version of the AVERT Main Module.
What other tools are available?
Methods for projecting avoided emissions from power plants range from basic to sophisticated. Basic methods assume consistent energy savings throughout the year and assign marginal emission rates or specific emission rates for proxy unit types. At the other end of the spectrum are sophisticated methods that can provide detailed forecasts of regional supply and demand impacts over time. This category includes true dispatch models that can incorporate detailed assumptions about future market conditions (e.g., fuel prices, emissions budget trading program effects, dispatch changes).
For more information about the strengths, limitations, and trade-offs between the various modeling methods and tools available, see Chapters 3 and 4 of Quantifying the Multiple Benefits of Energy Efficiency and Renewable Energy: A Guide for State and Local Governments.
AVERT offers an intermediate level of complexity. While it may be ideal for certain types of analyses, there are also many other tools available that provide other advantages, depending on the level and type of analysis one wishes to conduct. Examples of other tools and resources you might find useful include:
- eGRID: A comprehensive EPA source of data on the environmental characteristics of almost all electric power generated in the United States; it includes two types of emission factors based on annual average conditions.
- Power Profiler: An EPA tool that makes it easy to look up summary data (including regional emission factors) from eGRID.
- Air Markets Program Data: EPA’s searchable database of air emissions and related data that EGUs and other facilities report to EPA; it is a key underlying source for AVERT and other power sector inventories.
- GridPIQ: A more intricate modeling tool from the U.S. Department of Energy that allows you to model the electric grid impacts of photovoltaics, electric vehicle “smart charging,” and other “smart grid” technologies; it borrows the AVERT algorithm to estimate the impact of these technologies.
- Combined Heat and Power (CHP) Energy and Emissions Savings Calculator: An Excel-based tool that calculates the estimated air pollutant emissions from a CHP system, compared with a separate heat and power system.
- Power Sector Modeling: An index of EPA's power sector modeling resources and power sector models used for long-term, economics-driven power sector projections and regulatory applications.
- GLIMPSE: A decision support modeling tool being developed by EPA that will allow users to explore future impacts of energy technologies and policies on the environment.