Introduction to the 2019 TRI National Analysis
TRI Reporting
Under the Emergency Planning and Community Right-to-Know Act (EPCRA) and the Pollution Prevention Act (PPA), facilities that meet TRI reporting requirements must report details about their pollution prevention and waste management activities, including releases, of TRI-listed chemicals for the prior calendar year to EPA’s TRI Program by July 1 of each year.
Industries and businesses in the United States (U.S.) use many chemicals to make the products we depend on, such as pharmaceuticals, computers, paints, clothing, and automobiles. While most chemicals on the Toxics Release Inventory (TRI) chemical list are managed by these facilities in ways that minimize releases into the environment, releases still occur as part of normal business operations.
It is your right to know what TRI chemicals are being used in your community, how chemical waste is managed including how much is released into the environment, and whether such quantities are increasing or decreasing over time.
The TRI tracks the management of certain chemicals from the information reported to EPA each year by facilities located in the U.S. in industry sectors such as manufacturing, metal mining, electric utilities, and hazardous waste management. The data reported to TRI are compiled in a publicly available EPA database. For calendar year 2019, more than 21,000 facilities reported to EPA’s TRI Program.
Watch a short video about the TRI Program and your right to know
Each year, in support of its mission to protect human health and the environment, EPA analyzes the most recent TRI data and publishes its findings in the TRI National Analysis.
Overview of the 2019 TRI data
The two pie charts below summarize the most recent TRI data: 1) on how facilities managed production-related TRI chemical wastes through recycling, energy recovery, treatment, and disposal or other releases; and 2) for the quantities of the TRI chemical wastes released to the environment, the proportions released to air, water, and land.
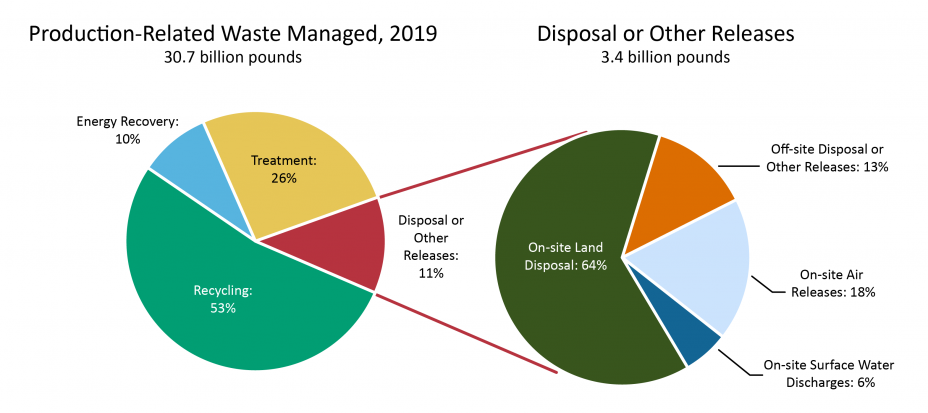
Note: To avoid double counting, the Disposal or Other Releases pie on the right excludes quantities of TRI chemicals that are transferred off site from a TRI-reporting facility and subsequently released on site by a receiving facility that also reports to TRI. Percentages do not sum to 100% due to rounding.
- Facilities reported managing a total of 30.7 billion pounds of TRI-listed chemicals as production-related waste during 2019. Production-related waste is the quantity of TRI chemicals in waste generated from routine operations at facilities. This includes TRI chemicals in wastes that are recycled, combusted for energy recovery, treated, disposed of, or otherwise released into the environment.
- Of this total, 89% was recycled, combusted for energy recovery, or treated. Only 11% was disposed of or otherwise released into the environment.
- For chemical wastes that were disposed of or otherwise released, facilities also reported whether the wastes were released to air, water, or land, the quantities released, and the locations of the releases. Most releases occur on site at facilities, but chemical waste may also be shipped off site for disposal, such as to a landfill. As shown in the pie chart on the right, most waste was disposed of to land, which includes landfills, underground injection, and other land disposal.
- To view these data in a table, see Quick Facts under TRI Data Considerations.
Where are the Facilities that Reported to TRI for 2019 Located?
Click on any of the locations to see a facility’s TRI information.
View Larger Map
This page was published in January 2021 and uses the 2019 TRI National Analysis dataset made public in TRI Explorer in October 2020.