Regional Profiles
This section of the National Analysis looks at releases and other production-related waste management![]() production-related wasteThe sum of all non-accidental chemical waste generated at a facility. It is the sum of on-site environmental releases (minus quantities from non-routine, one-time events), on-site waste management (recycling, treatment, and combustion for energy recovery), and off-site transfers for disposal, treatment, recycling or energy recovery. activities of Toxics Release Inventory (TRI) chemicals at the EPA regional level during 2019. EPA has 10 regional offices, each of which is responsible for multiple states and in some cases, territories and tribes.
production-related wasteThe sum of all non-accidental chemical waste generated at a facility. It is the sum of on-site environmental releases (minus quantities from non-routine, one-time events), on-site waste management (recycling, treatment, and combustion for energy recovery), and off-site transfers for disposal, treatment, recycling or energy recovery. activities of Toxics Release Inventory (TRI) chemicals at the EPA regional level during 2019. EPA has 10 regional offices, each of which is responsible for multiple states and in some cases, territories and tribes.
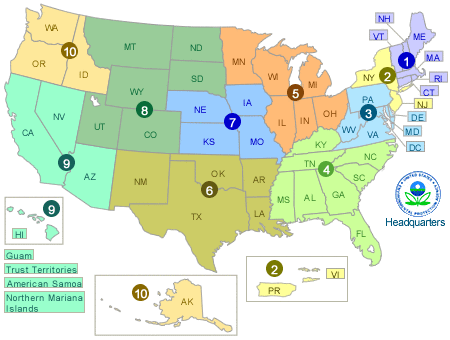
EPA regions vary significantly in many important characteristics, including size, population, and the types of facilities located in each region. These factors result in significant differences between national and regional trends in TRI chemical waste management. For example, certain activities such as metal mining are geographically concentrated and generate large quantities of TRI chemical waste. As a result, release trends in regions with many metal mines often do not mirror national release trends.
The charts below show: 1) production-related TRI chemical waste managed, which includes management through recycling, combustion for energy recovery, treatment, and disposal or other release; and 2) the portion of production-related waste that is released, by EPA region.
The relative amounts of production-related waste managed compared to releases in each region is largely explained by the types of industry located in each region. For example:
- In Regions 8, 9 and 10, metal mines accounted for more releases than any other sector. Metal mines tend to have high releases due to the large quantities of metals disposed of on site to land. For quantities of waste managed through treatment, energy recovery and recycling, metal mines rank lower than almost all other sectors, resulting in lower production-related waste managed in regions with substantial metal mining operations.
- Region 6 had the largest quantity of production-related waste managed, driven by facilities in the chemical manufacturing sector treating chemicals on site, such as ethylene, toluene, and propylene.
- Quantities of production-related waste managed in Regions 3, 4 and 5 were largely from the chemical manufacturing sector. Each of these regions include one chemical manufacturing facility that reported high quantities of chemicals recycled on site. For example, in Region 3, one facility reported 3.6 billion pounds of cumene recycled, and in Regions 4 and 5, one facility in each region reported recycling over one billion pounds of dichloromethane (methylene chloride). The recycling quantities at these individual facilities are major contributors to the large quantities of TRI production-related waste managed in these regions.
TRI Data Considerations
As with any dataset, there are several factors to consider when using the TRI data. Key factors associated with data used in the National Analysis are summarized in the Introduction. For more information see Factors to Consider When Using Toxics Release Inventory Data.
This page was published in January 2021 and uses the 2019 TRI National Analysis dataset made public in TRI Explorer in October 2020.