Nested Dichotomous Data (Use with Benchmark Dose Software (BMDS) Version 2.7)
BMDS 2.7 is no longer under active development. With a few exceptions, most models are now maintained in BMDS 3.x.
In a nested study, a group of animals are treated with a particular dose of chemical, and the end point examination is conducted in a subset of subjects from each treated individual – the pups of the treated mother, for example. Because each mother may produce 15-20 pups, if you have 20 treated mothers, you would have 20 observations from each mother. So the observation sample size is larger than that of the original treated animals.
Developmental effects could range from skeletal structure change, delayed ossification in the bone, or organ structural change to malformation. Since all those observations are made in pups, but not in the mothers, these data should be considered nested data.

You can find more detailed information on nested dichotomous data in the online training.
Before You Start
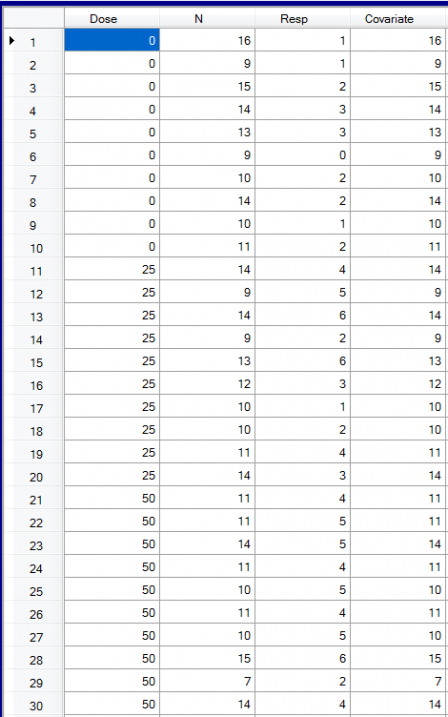
Download nested_exercise.zip (ZIP)(1 pg, 926 B) and extract the Rogers.dax dataset to the BMDS\Data subdirectory. You will use this dataset for Exercise 2.
Exercise 1
This exercise will introduce the concept of nested data and show you how to use the nested models in BMDS. The exercise uses the Nested.dax dataset included with the standard BMDS installation.
- From within BMDS, select File>Open>Dataset (.dax). Select and open the Nested.dax file. BMDS opens the file in a new data grid window.
-
In the Data Grid window, from the Model Type picklist, select Nested_Dichotomous. From the Model Name picklist, you can select one of three models:
- NLogistic - The Nested Logistic Model is the log-logistic model
 logistic modelA sigmoid (S-shaped) function that relates the proportion of individuals with a specified characteristic to an independent variable, e.g., dose., modified to include a litter-specific covariate
 covariateAn independent variable other than dose that may influence the outcome of an effect, e.g., age, body weight, or polymorphism..
 - NCTR - The NCTR model is a Weibull
 WeibullForm of a dose-response curve characterized by a relatively shallow slope at low doses that increases sharply as dose increases before leveling off at high doses. model modified to include a litter-specific covariate.
 - Rai and Van Ryzin - The Rai and Van Ryzin model is a Weibull model modified to include a litter-specific covariate.
- NLogistic - The Nested Logistic Model is the log-logistic model
- Select the NLogistic model.
- Click the Proceed button to display the Model Options screen for the selected model. Specify the column assignments and accept the defaults.
- Click the Run button. BMDS displays the graph and text results. You can minimize the Results window for now.
- Go back to the Data Grid and run each of the remaining models (NCTR and Rai and Van Ryzin), again accepting the defaults.
- Redisplay the three Results windows. Look at the differences in the graphs, the parameter estimates, etc.
You should see results similar to those in the table below. How do the AICs differ? The BMD and BMDL values?
Which model type (NLogistic, NCTR, Rai and Van Ryzin) would you choose and why?
You would generally choose the NLogistic because it has the lowest AIC and a low BMDL.
Exercise 2
In a 1993 paper, Rogers, et al., describe a Log-Logistic BMD analysis of the developmental effects of methanol on CD-1 mice.
- Start BMDS and select File>Open>Dataset (.dax). Open the Rogers.dax file you previously downloaded. The dataset opens in a Data Grid window.
- For Model Type, select Nested_Dichotomous. For Model Name, select NLogistic.
- For this exercise, we want to delete the four high-dose items. To do this, scroll to the end of the dataset, highlight the cells for the last four rows, and press the Delete key. The cell values should be cleared.
- Click the Proceed button to display the Model Options screen for the selected model.
- Specify the column assignments for Dose, Litter Size, Incidence, and Litter Specific Covariate.
- For this run, we will accept the defaults in the Other Assignments section.
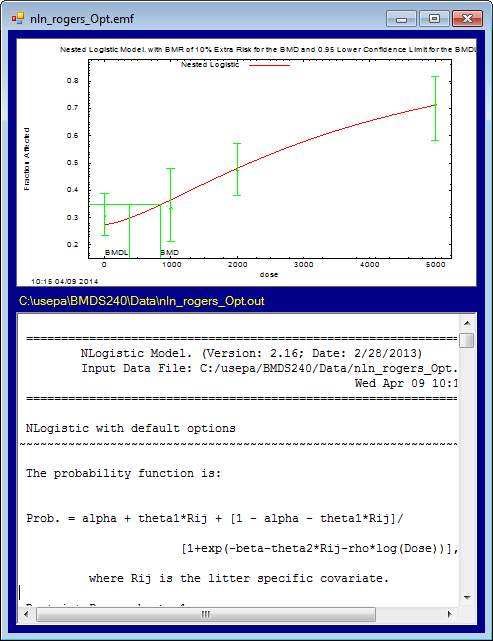
- Click the Run button. In a few seconds, BMDS displays graphical and text results. You should see a window similar to the following screenshot:

What is the AIC value associated with this model run?
1049.33
- Close the Model Options and Results windows so that the Rogers.dax dataset is the only window open. Click the Proceed button. A new Model Options window displays.
- Specify the column assignments for Dose, Litter Size, Incidence, and Litter Specific Covariate.
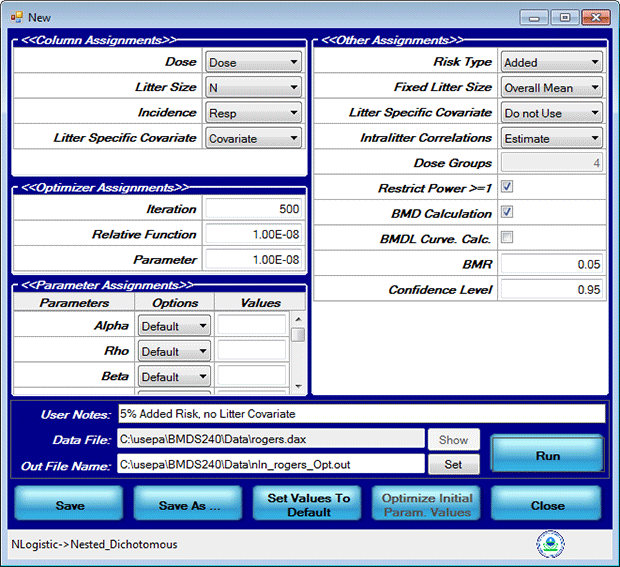
- For this run, we want to specify 5% additional risk
 additional riskThe additional proportion of total animals that respond in the presence of the dose, or the probability of response at dose d, P(d), minus the probability of response in the absence of exposure, P(0). and we do not want to use the Litter Specific Covariate. In the Other Assignments section:
- Select a Risk Type of "Added" and specify a BMR of 0.05.
- Change Litter Specific Covariate to "Do Not Use."
Your Model Options dialog should resemble the following screenshot:
-
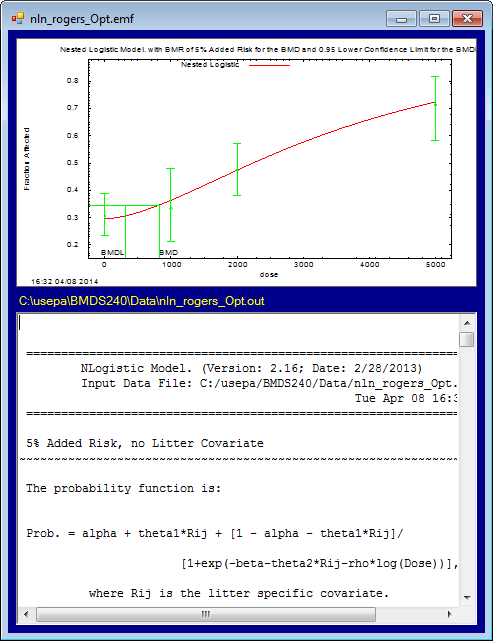
Click the Run button. In a few seconds, BMDS displays graphical and text results. You should see a window similar to the following screenshot:

What is the AIC value associated with the second model run?
1053.46
Previous: ten Berge Concentration x Time Model (Use with BMDS)
