Viewing Text and Graphics Output in Benchmark Dose Software (BMDS) v2.7 and BMDS Wizard
BMDS 2.7 is no longer under active development. With a few exceptions, most models are now maintained in BMDS 3.x.
ICF no longer offers or supports BMDS Wizard.
Viewing Text and Graphics Output in BMDS
After you have specified all the pre-requisites (models, data, parameters) for a session run, click the Run button. The status bar will display a "Please wait processing..." message and a progress bar as BMDS calculates the results.
A result consists of a plotted graph for the model plus its Out File data display. Results are grouped by endpoint unless otherwise specified in the Tools> Options... menu.
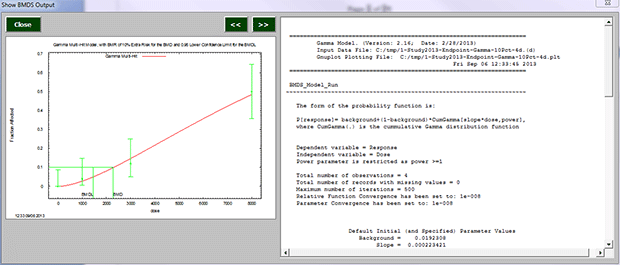
The following screenshot from BMDS shows an example of an individual graph and output file data display for a dichotomous model following a model run.
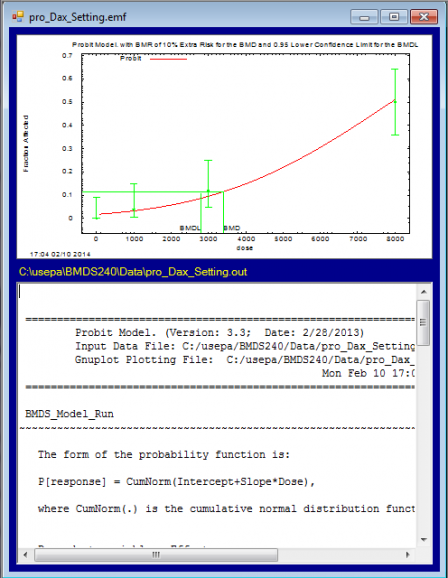
- The graph and text are paired into their own window. Resize the window and scroll through the text report as you compare it to the graph.
- The graph has an *.emf extension, meaning that it is a Windows Enhanced Metafile. You can right-click on the graph and copy it into another file for editing (such as PowerPoint) or reporting (such as Word). The *.plt plot file that serves as the basis for the graph is located in the BMDS240\Data directory.
- The text output file in the screenshot has the extension “*.out” and is located in the BMDS240\Data directory. The Out file is a simple text file you can open using Notepad. Click to view a sample BMDS .out file (Text)(1 pg, 4 K) .
Text Output from Models
The purpose of the BMDS output file is to provide you with goodness-of-fit criteria and model results that will help you determine the appropriateness of the subject model to the benchmark dose derivation, as shown here.
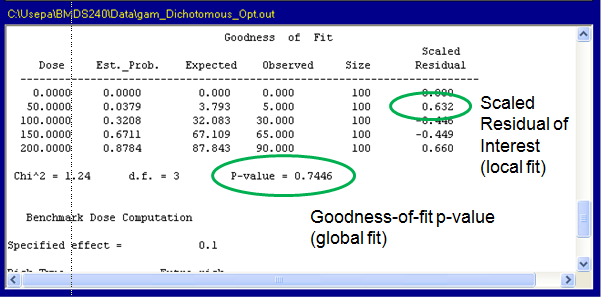
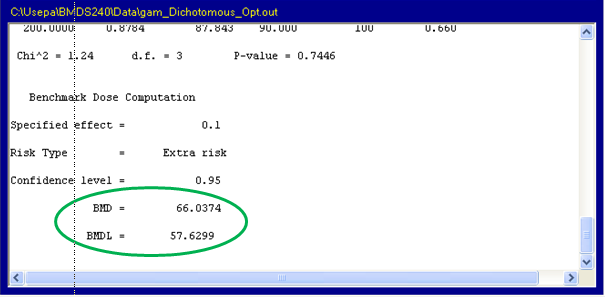 The output file also lets you quickly verify the options you selected on the Model Options screen. For instance, if two users compared results and obtained different answers, they can consult the output pages to ensure they used the same settings or if they had used the same (or most current) version of the software/models.
Graphics Output from Models
The plot (*.plt) file that serves as the basis for the graph is located in the BMDS Data subdirectory; it will have the same filename as the *.emf and *.out files in the output window.
You view the plot files using GnuPlot, an open-source program that is included as part of the standard BMDS installation. You can find the GnuPlot files (wgnuplot.exe and wgnupl32.exe) in the BMDS application directory.
- Select Tools>View Plot File…. BMDS displays all the .plt files in the Data subdirectory.
- Scroll through the list of files to find the pro_Dax_Setting.plt file. Select the file and click OK. The GnuPlot window opens and displays the chosen plot.
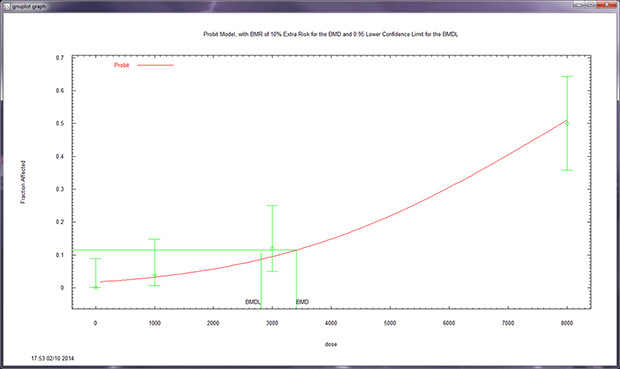
- The BMD and BMDL are identified on the plot as green vertical lines and are associated with the response level associated with the user-selected BMR, the horizontal green line.
- The BMD curve estimated by the model is represented by a red line.
- Data points are shown in green with their individual group confidence intervals.
Customizing the Graphics Output
GnuPlot offers many editing and customization features you may find useful when transforming the plots for use in reports or other media.
- Copying to the clipboard. You could then paste the graphic into another vector-graphics or presentation program, such as Microsoft PowerPoint.
- Changing the background color.
- Specifying different colors, line styles (solid, dash, line widths, etc.), and fonts. You can use these functions to adjust a color graphic for black-and-white printing.
- Specifying printing options, such as landscape or portrait.
Viewing Text and Graphics Output in BMDS Wizard
The BMDS Wizard’s Results worksheet displays all model results for the subject dataset. In the View Output File column, click the View Output link for each model to display a window showing both the BMDS output graph and output file.
Clicking the View Output Images button on the Results tab displays the Output worksheet, where all of the output files are displayed.
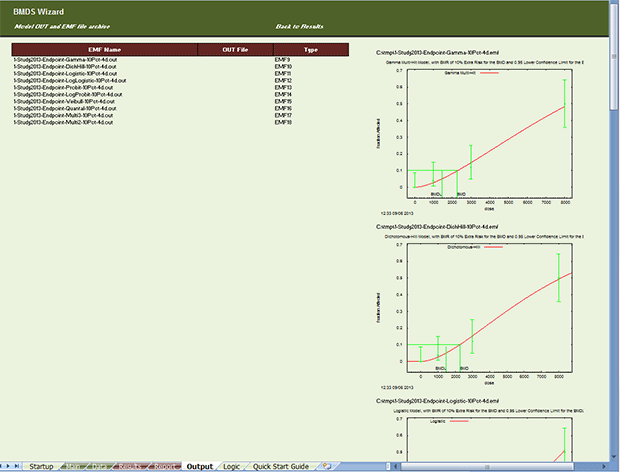
All output files and images are embedded in the BMDS Wizard file, so you can share the file with others. The plot files in Wizard can also be copied and pasted into another application capable of performing vector graphic editing (e.g., Microsoft PowerPoint).
For more information on viewing BMDS Wizard results, refer to the BMDS Wizard User’s Reference Guide, section 2.7, “Viewing Imported Results.”
Next: Multiple-Tumor Analysis with MS_Combo model (Use with BMDS Wizard)
