Figure: Explanation of Inconsistent Evidence
Illustration
If recovery has not occurred one month following elimination of the candidate cause (the effluent), then spatial/temporal co-occurrence is not complete. However, it may be explained by the fact that recolonization is blocked by a weir and enough time has not elapsed for recovery by reproduction, which might be observed a year later (upper panel). That explanation supports the candidate cause. There is no such explanation for the continuation of the impairment (more dead fish) one month after elimination of exposure to the candidate cause (lower panel).
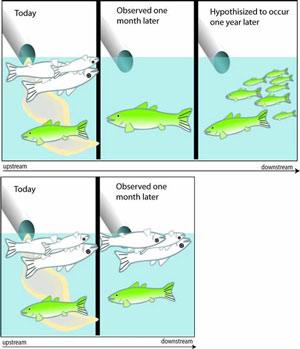 Figure 5-1. Illustration of an Explanation of Inconsistent Evidence.
Explanation of the Types of Evidence Illustrations
This description applies to each of the types of evidence illustrations. These illustrations provide graphic explanations of the types of evidence. They are somewhat abstract to convey that they are representative of the concept rather than illustrations of particular applications. The live fish (green and upright) represent unimpaired organisms, populations or communities of all types, not just fish. The dead fish (white and belly-up at the surface) represent all biological impairments, not just dead fish. The pipe represents all sources and the yellow effluent plume represents all causal agents (stressors), not just effluents or even chemicals. Clock faces represent the passage of time, not the particular time difference illustrated. Fish in beakers represent laboratory tests. Other graphic elements used in particular illustrations are explained in the caption.