Step 3. Evaluate Data from the Case
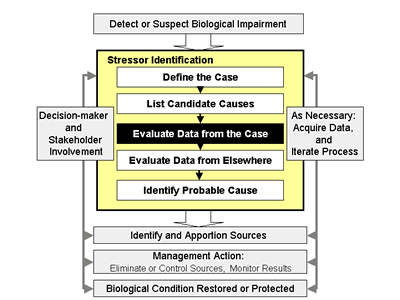 Figure 3-1. Illustration showing where Step 3: Evaluate Data from the Case fits into the Stressor Identification process.
In Step 3 (Figure 3-1), you evaluate data from the case by assembling and analyzing the data, with two goals in mind:
- To develop consistent, credible evidence that allows you to confidently eliminate very improbable causes, or to use symptoms to refute or diagnose a cause, and
- To begin building the body of evidence for candidate causes that cannot be eliminated or diagnosed. This evidence is used in Step 5 to identify the most probable causes.
Analyses conducted during this step combine biological response measurements (e.g., trout abundance, invertebrate taxonomic richness) with direct proximate stressor measurement (e.g., toxicant concentrations, percent embeddedness). Measures of other steps linking sources, candidate causes and biological effects may also be included.
For example, if low dissolved oxygen (DO) constitutes the candidate cause, data from the case may include actual DO measurements at impaired and reference sites; evidence that organisms intolerant of low DO have declined at the impaired site; and/or measurements of increased organic matter (one potential step in the causal pathway) at the impaired site.
Questions that Frequently can be Addressed Using Data From the Case
- Do the candidate cause and the effect occur in the same location?
- Is there a complete series of events linking the source to the causal agent?
- Does the magnitude of the effect increase with the magnitude of exposure to the causal agent?
Questions that Less Frequently Can be Addressed Using Data From the Case
- Did exposure to the candidate cause precede the effect?
- Are there biomarkers or other mechanistic indicators linking exposure to the proximate stressor to the adverse biological effect?
- Does the biological effect change in response to intentional manipulation of the stressor in the case?
- Are there diagnostic symptoms or patterns?
Each type of evidence should be evaluated and you should document the analysis and results are documented. The degree to which each type of evidence supports or weakens a case is scored using a standard system. Data from the case may show that it is impossible or extremely improbable that a candidate cause produced the observed effect. If this happens, that candidate cause can be eliminated from further consideration. Certain symptoms may allow for confident diagnosis or refutation of a candidate cause.
Scores for remaining candidate causes are combined with scores assigned after data from outside the case are included in
In-Depth Look
Causal analyses often begin with an examination of data from the case at hand. For example, a field biologist might observe that effects occur when a particular candidate cause is present, but do not occur when it is absent. Such associations provide the core of information used for characterizing causes.
We recommend that associations from the case be evaluated first, because they can be powerful enough to eliminate candidate causes from further consideration. Associations derived from other cases or biological knowledge cannot be used to refute a candidate cause, but can provide useful supplemental information for comparing strength of evidence.
For example, a common assessment method compares ambient chemical concentrations with concentrations causing effects in laboratory studies. However, these types of evidence have substantial uncertainties associated with the type of laboratory organisms, extrapolation from lab to field, and so on. This and other types of evidence that bring in data from outside of the case are described in Step 4: Evaluate Data from Elsewhere.
Assembling the Data
Analyzing Associations
Data are analyzed in terms of associations that might support, weaken or refute a candidate cause, using the types of evidence discussed below.
Volume 4: Data Analysis provides a section that helps you prepare and organize your data before analysis, and to evaluate data sources and quality. This volume also provides suggestions for selecting an analysis approach for your data. Useful descriptive and statistical methods are described including scatter plots, correlation analysis, box plots, regression analysis, conditional probability analysis, and predicting environmental conditions from biological observations.
- Data Analysis: Getting Started
- Selecting an Analysis Approach
- Basic Principles and Issues
- Exploratory Data Analysis
- Basic Analyses
- Advanced Analyses
If you have listed multiple stressors as a candidate cause, the analyses of data from the case should be based on those aggregate causes. For example, if all divalent metals or all polycyclic aromatic hydrocarbons have been combined using a concentration additivity model, then all analyses of associations of that cause with effects should be performed using the sums of toxic units rather than the individual concentrations.
Additional specific issues are discussed in each type of evidence's information page (see links provided below and in the Summary Tables of Types of Evidence on the left navigation bar).
Types of Evidence that Use Data From the Case
The evidence generated by analyzing associations among data or observations from the case typically fall into one of following types. It is important to avoid double counting by not using a piece of evidence as more than one type.
- Spatial/Temporal Co-occurrence
- Evidence of Exposure or Biological Mechanism
- Causal Pathway
- Stressor-Response Relationships from the Field
- Manipulation of Exposure
- Laboratory Tests of Site Media
- Temporal Sequence
- Verified Predictions
- Symptoms
Using the Evidence to Evaluate Candidate Causes
The associations are evaluated by considering the degree to which they support or weaken the case for a candidate cause. We recommend scoring the evidence using a standard set of scores. These scores are described on each type of evidence's information page and are compiled in the Summary Table of Scores.
Evidence based on case-specific data can be strong enough to eliminate an improbable cause from further consideration. The objective of elimination is to logically establish that a candidate cause is extremely improbable, or better yet, impossible and could not have produced the effect of concern. Evidence with strongly negative scores may be sufficient to refute, and thus eliminate, the cause. Because eliminated causes are not evaluated further, you must have sufficiently high confidence in the evidence to support this decision. When in doubt, the cause should be retained.
Results and Next Steps
- A summary of the supporting data, analyses, and scoring rationale for each type of evidence that was evaluated:
- A table containing all of the scores you assigned:
- A list of the causes that you either eliminated or diagnosed. This list is formed by first scrutinizing the negative results, which are more likely to be decisive and may have been strong enough to refute a candidate cause. You should also carefully review evidence of symptoms that were strong enough to score a "D" (for diagnosed) or "R" (for refuted), to make certain those symptoms are sufficiently characteristic of a candidate cause to support the conclusion.
These three sets of results are still interim products. The results for the candidate causes that are refuted or diagnosed are set aside until overall conclusions are made in Step 5. For the candidate causes that remain, additional evidence using data and information from outside the case is sought in Step 4.