Getting Started
CADDIS provides a pragmatic guide for determining the causes of undesirable biological conditions in aquatic systems. The process presented on the CADDIS website is derived from the Stressor Identification Guidance Document published by U.S. EPA's Office of Water and Office of Research and Development. The basic approach remains the same, but we have made the process more accessible and expanded the concepts with examples and case studies.
Using the Step-by-Step Guide
 Click to download the Stressor Identification Guide.The Step-by-Step Guide organizes the Stressor Identification process into five steps. Each step is organized into an overview, an in-depth look and results and next steps. In Step 5, the in-depth look is further divided into weighing and comparing the evidence.
Throughout the site, supplemental information and links are provided that lead to related information in other parts of CADDIS or outside of the website. Navigating CADDIS may be easier if these helpful links are viewed in a separate tab or window (e.g., by right clicking on the link and then selecting "Open Link in New Tab" or "Open Link in New Window").
We recommend that new users first read the Guide Overview, which summarizes the entire process. The Fundamentals of Causal Assessment section then summarizes the principles and methodology underlying CADDIS.
Guide Overview
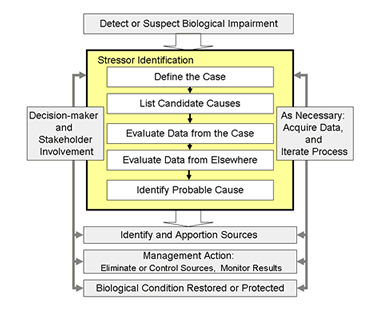 Figure 1. The Stressor Identification process within its broader management context.The Stressor Identification (SI) process, shown inside the yellow box in the center of the Figure 1, follows five steps that conclude with the identification of a probable cause. The gray boxes around the Stressor Identification process show various interactions and the context for the analysis.
You will see this figure referenced throughout the Step-by-Step Guide volume, with different boxes bolded in black to indicate where you are in the process.
On this Page
Before the Causal Analysis Begins
Detect or Suspect Biological Impairment
One example is the requirement of the Clean Water Act to identify and remediate impaired bodies of water. The cause must be known in order to develop an effective management plan. The requirement for the U.S. EPA to identify, report and develop plans to improve impaired bodies of water appears in the 305b and 303d clauses of the Clean Water Act.
What are the characteristics of an impaired waterbody? This website assumes that you already know that your stream or river is biologically impaired. For more information on making this determination, refer to U.S. EPA guidance on evaluating the biological condition of bodies of water (Biocriteria and Biological Assessment). Types of biological impairments that may warrant a causal analysis include fish kills, algal blooms, loss of biological diversity or unusual composition of biological assemblages.
Decision-Maker and Stakeholder Involvement
Causal analysis requires some data and knowledge about ecology. Ecology is an inclusive science that integrates understanding of biological, physical and chemical processes in complex, interactive landscapes. Individual scientists can independently perform causal analyses, but a team often does it better. Effective causal analysis teams include members with expertise in a wide variety of environmental fields, and strong analytical, social, and communication skills. Social skills are particularly necessary when communicating the needs of the team to stakeholders and decision-makers, and when enlisting their support after the cause has been identified and it is time to correct the problem.
Stakeholders and decision makers can be viewed as part of the extended team engaged in the investigation to find the cause of a biological impairment. They can be sources of information. They can suggest possible causes of impairment and often know about historical impacts that may no longer be present or which have become hidden by a changing landscape.
Involve your stakeholders and decision-makers often. When the cause has been identified and it's time to take action, you will need community support to make environmental improvement a reality.
As Necessary: Acquire Data and Iterate Process
Causal analysis requires data, which may come from any reliable source. Data are used to show causal relationships between candidate causes and specific effects. New data may become available at any step of the process or you may decide to obtain more information to fill identified data gaps. These are normal iterations of the Stressor Identification process and can occur at any time. In fact, a screening level causal analysis is very useful for identifying the types of measurements and locations for sampling that will clinch a case.
Step 1: Define the Case
- A description of the reason for the causal analysis, usually a description of the general biological impairment and any regulatory violation,
- Descriptions of the methods and data used to determine the biological impairment,
- Maps and descriptions of the land use, locations of sampling sites, and possible sources of pollutants,
- Descriptions of the specific biological impairments and criteria that were used to determine them.
Step 2: List the Candidate Causes
Causal analysis identifies the most probable cause of an impairment from a larger set of candidate causes. The list of candidate causes arises from several \activities and sources including the information gathered in Step 1. There are several ways to develop a list of candidate causes. Additionally, you may choose to brainstorm a list with colleagues or stakeholders. If there are stakeholders that staunchly believe that a biological impairment is due to a particular cause, include that cause no matter how unlikely it may seem. They need to be shown the evidence for or against that candidate cause.
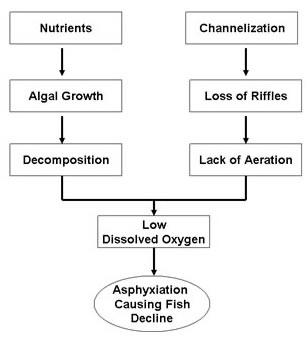 Figure 2. A simple conceptual model diagram showing two pathways leading to low dissolved oxygen and fish decline.Here are several other suggestions:
- Consult lists of candidate causes that are commonly encountered.
- List sources and the stressors generated by the sources or land uses.
- Search the literature for candidate causes associated with the specific effects that have been observed.
- Construct or consult conceptual models that show sources, processes, and candidate causes that are known to give rise to specific effects. For example, Figure 2 is a very simple example of a conceptual model linking an effect (fish declines) to a candidate cause (low dissolved oxygen), and back to two ecological processes (nutrients and channelization) that might give rise to the candidate cause (and, by extension, the observed effect).
- A list of candidate causes,
- A conceptual model and description of sources, processes and candidate causes that are known to give rise to the specific effects observed in the waterbody being investigated.
Step 3: Evaluate Data from the Case
The most powerful evidence is based on cause-effect relationships developed from data obtained from the case itself. This evidence is developed in Step 3. Step 3 has two goals. The first is to use data from the case to develop evidence that allows you to confidently eliminate very improbable causes or use symptoms to refute or diagnose a cause.
The second goal of Step 3 is to begin building the body of evidence for those candidate causes that cannot be refuted or diagnosed, which will be used in Step 5 to identify the most probable causes. The more types of evidence and the more characteristics that support a candidate cause the more likely that it IS the true cause. The more types of evidence that weaken the case for a candidate cause the more likely that it IS NOT the true cause. Logical and statistical approaches that are used to develop evidence are described in more detail in Fundamentals of Causal Analysis and in Step 3 of the website.
- Describing the data,
- Describing the analysis,
- Scoring the evidence,
- Discussing the scores, including an evaluation of the quantity and quality of the data, and the reasons for applying the scores
- Documenting the candidate causes refuted or confirmed by diagnosis.
Refuted causes require no further analysis, but are revisited when summarizing the overall conclusions. Confirmed diagnoses by definition are probable causes and require no further analysis, but are also revisited when describing probable causes in the final summary. All other candidate causes are further evaluated in Step 4.
Criteria for Eliminating a Candidate Cause
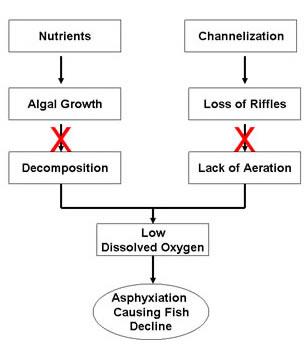 Figure 3. Low dissolved oxygen can be eliminated as a possible cause in this simple example because no excess algal growth or loss of riffles that aerate water were observed.If data from the cases shows that any characteristic of a causal relationship is very improbable, you have a very strong case for eliminating a cause. For example, in Figure 3, the red "x"’s on the arrows are drawn because riffles were observed at the site, algal growth was minimal, and continuously monitored oxygen levels were always near saturation. Therefore the case for low dissolved oxygen can be confidently refuted.
Criteria for Diagnosis
Diagnosis is possible when the effect is described by certain symptoms that are always present and those symptoms only have one cause. When the symptoms are absent, the candidate cause is refuted and eliminated from further consideration. When the symptoms are present, the candidate cause is diagnosed and is confirmed as the probable cause.
- Use the data you have. It may not give you a confident answer, but it usually tells you something. At a minimum, you can use it to determine what additional information you would like to collect.
- Document the assumptions and choices you make. For example, you may have decided to use maximum values to represent a worst-case scenario. Or you may have chosen to use average values because the impairment is chronic rather than acute or episodic in nature. In either case, document the decisions!
Step 4: Evaluate Data from Elsewhere
Most candidate causes cannot be diagnosed or eliminated. Further evaluation is required that uses knowledge gained from laboratory studies and from past experiences and observations in other waterbodies. For example, one of the most useful types of evidence from elsewhere uses the stressor-response relationships developed from laboratory studies. Familiar examples are single chemical, single species toxicity tests. The primary goal in Step 4 is to develop evidence that uses data from elsewhere. Logical and statistical approaches that are used to develop evidence are described in more detail in Fundamentals of Causal Analysis and in Step 4 of the website.
- Describing the data,
- Describing the analysis,
- Scoring the evidence,
- Discussing the final scores, including an evaluation of the quantity and quality of the data, and any extrapolations needed to apply the evidence to the case at hand.
Step 5: Identify Probable Cause
- Scores for all the types of evidence used displayed in a table,
- Evaluation of the consistency and credibility of the case based on the scores,
- Identification of the most compelling lines of evidence,
- Determination of the candidate cause as probable, unlikely, refuted or diagnosed,
- Discussion of the reasons for that determination,
- A report documenting the causal assessment.
- Use data from the case
- Are based on more than one piece of evidence
- Effectively link the causal agent with the effect
All of the evidence is evaluated for consistency by looking at the overall pattern of scores. Confidence in the argument for or against a candidate cause is increased when it is supported by many types of evidence. If there are inconsistencies, now is the time to determine whether they are important or can be explained.
Now, the hard part! The overall body of evidence for each cause is weighed, the most compelling lines of evidence are reviewed, and a determination is made. The criteria for determining probable and unlikely causes are described in Step 5 of this guide. But be forewarned, there is no mathematical formula for making the overall determination. Statistical hypothesis testing is inappropriate. Instead, the determination is based on the scientific evidence that you have. Does the evidence show that the candidate cause and the effect exhibit more than one characteristic of causal relationships? Are the characteristics of causal relationships evident and supported by several types of evidence? Is the evidence compelling, consistent and credible?
Each of the candidate causes is evaluated this way. Then, the cases for all of the candidate causes are compared against each other to reach a final conclusion. It is not uncommon to identify more than one candidate cause, or to conclude that multiple causes are operating. The Stressor Identification process should help clarify the possibilities and provide insights into management options. For example, it may be possible to remediate more than one candidate cause at a time. Other typical situations in which the findings are not clear cut are described in Step 5 of the guide. Remember that you are not trying to prove or disprove a grand scientific theory. Rather, you are comparing the relative merits of the candidate causes in order to support decision-making.
- The reason for the causal analysis,
- A list of the candidate causes and the ecological theory supporting them,
- The sources of the data used in the analysis,
- Tables of the evidence and scores derived from the data,
- Conceptual models of the causal pathways, and
- The key evidence used to distinguish the probable from the unlikely causes.
The more costly or controversial the remediation and the more skeptical the decision-maker, the more complete the documentation must be. The bottom line is a statement of your reasons for identifying the probable cause and for determining that other candidate causes are unlikely. Use what works for you:
- Example Summary Tables and Narratives from the Little Scioto River, OH, USA
- Annotate the Conceptual Models with Evidence
After the Causal Analysis is Done
Identify and Apportion Sources, Management Action, Biological Condition Restored or Protected
Research underway at the U.S. EPA and in other federal, private and academic research programs will continue to provide insights for selecting and implementing effective management options. So, don't stop with just our suggestions.
If a management action occurs at your site, monitoring the reduction in the causal agent and changes in the biological impairment can demonstrate progress and confirm or refine the findings of the causal analysis. That is, changes stemming from the management action can allow you to determine whether the "real" cause was targeted for action or not. If biological improvement is marginal even with significant reductions in the causal agent, there may be other unidentified causes. If the stream improves dramatically, call a press conference and have a celebration with your stakeholders. Let us know, too—we like to celebrate as well!
Fundamentals of Causal Assessment
This page briefly discusses the fundamental principles of causal analysis upon which the Stressor Identification Guidance Document and CADDIS are based. Causation is essential to science and everyday life, but it has been a topic of controversy in the philosophy of science, and causal analysis can pose practical difficulties.
We based our approach on three particularly useful concepts for analyzing causes:
-
Discrimination of Site and Other Data
Because our purpose is to determine the cause of impairment of a particular ecosystem, we focus on discovering evidence of causal associations at the impaired site. Associations made using only data from the site are highly relevant but may be misleading, because coincidental associations are confounding. Evidence from other field and laboratory studies is less relevant to the site, but can indicate which associations are likely to be causal. We use evidence from both sources, but discriminate between them during the analysis so that they are properly interpreted.
-
Multiple Methods
We have adapted and integrated three methods for determining the most likely cause.- Refutation. Karl Popper (1968) and others have argued quite convincingly that a causal hypothesis can be falsified with greater confidence than it can be accepted. We may tentatively believe that the rooster's crow causes the sun to rise, because of the co-occurrence and temporal sequence of these two events, but we reject that hypothesis the first morning that we prevent the rooster from crowing. Similarly, when the evidence from the site allows, reject candidate causes.
- Diagnosis. As in medicine, we can make a very strong case for a cause if it is known to cause certain consistent signs in the impaired organisms or biotic communities. A set of diagnostic symptoms may come from the conventional signs of poisoning or disease or may come from the pattern of loss or gain of species that are indicators of particular conditions.
- Strength of Evidence. Sir Arthur Bradford Hill (1965) resolved the question "Does smoking cause lung cancer?" by organizing the evidence in terms of a set of causal criteria and then considering the overall strength of that evidence. We adapted that approach by identifying types of evidence that can be applied to information from the site and from elsewhere.
We also adapted Merwyn Susser's (1986a) idea of assigning scores to each type of evidence based on whether it strengthens (+) or weakens (-) the case for a candidate cause and on the strength of that type of evidence, represented by the number of plus or minus (+ or -) signs.
The three methods are integrated during the analysis of the strength of the fifteen types of evidence. If a type of evidence from the case is sufficient to refute a candidate cause, that candidate cause is rejected (scored R), and evidence from elsewhere need not be considered. If a set of diagnostic symptoms exists for a candidate cause and they are observed in the impaired system, the symptoms are scored D for diagnostic and that candidate cause is confirmed. Candidate causes that are neither rejected nor diagnosed are evaluated for their consistency (i.e., do all evaluated types of evidence strengthen or all weaken the candidate cause?). If inconsistencies occur, explanations are sought, based on background knowledge.
-
Comparative Analysis
Although it is not possible to prove causation, particularly in ecoepidemiological assessments that do not control the conditions of exposure and response, it is possible to compare candidate causes of a particular effect and determine which is best supported by the evidence. Hence, the last step in the causal analysis is a comparison of the candidate causes to identify the most probable cause.