Figure: Stressor-Response Relationships from Ecological Simulation Models
Figure 4-3. Stressor-Response Relationships from Ecological Simulation Models
If the impairment (dead planktivorous fish) is thought to be due to starvation rather than direct toxicity, a mathematical model can show how the loss of zooplankton is a function of exposure to the candidate cause (chloronaphthol) and the starvation of fish is a function of zooplankton abundance.
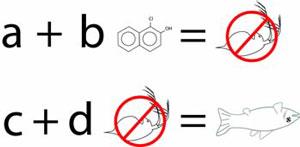 Figure 4-3. Stressor-Response Relationships From Ecological Simulation Models
Explanation of the Types of Evidence Illustrations
This description applies to each of the types of evidence illustrations. These illustrations provide graphic explanations of the types of evidence. They are somewhat abstract to convey that they are representative of the concept rather than illustrations of particular applications. The live fish (green and upright) represent unimpaired organisms, populations or communities of all types, not just fish. The dead fish (white and belly-up at the surface) represent all biological impairments, not just dead fish. The pipe represents all sources and the yellow effluent plume represents all causal agents (stressors), not just effluents or even chemicals. Clock faces represent the passage of time, not the particular time difference illustrated. Fish in beakers represent laboratory tests. Other graphic elements used in particular illustrations are explained in the caption.