Figure: Stressor-Response Relationships from Other Field Studies
Figure 4-1. Stressor-Response Relationships from Other Field Studies
Field studies from the region that associate measurements of the candidate cause (colored dots) with the intensity of the effect (proportion of dead fish) can be used to generate an exposure-response model. If concentrations in site water at the time of the fish kill (the impairment) are in concentration range A, the candidate cause is weakened. If they are in range B it is strengthened.
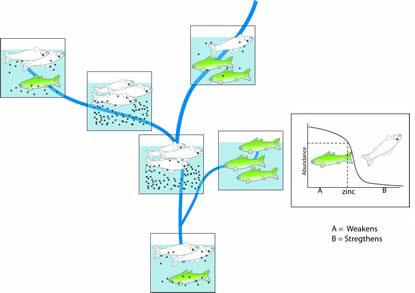 Figure 4-1. This illustrations shows the stressor-response relationships from other field studies
Explanation of the Types of Evidence Illustrations
This description applies to each of the types of evidence illustrations. These illustrations provide graphic explanations of the types of evidence. They are somewhat abstract to convey that they are representative of the concept rather than illustrations of particular applications. The live fish (green and upright) represent unimpaired organisms, populations or communities of all types, not just fish. The dead fish (white and belly-up at the surface) represent all biological impairments, not just dead fish. The pipe represents all sources and the yellow effluent plume represents all causal agents (stressors), not just effluents or even chemicals. Clock faces represent the passage of time, not the particular time difference illustrated. Fish in beakers represent laboratory tests. Other graphic elements used in particular illustrations are explained in the caption.