Figure: Symptoms
Figure 3-11. Symptoms
The impairment (low fish production) may be caused by many agents, but only a few cause the specific symptom (spinal deformity).
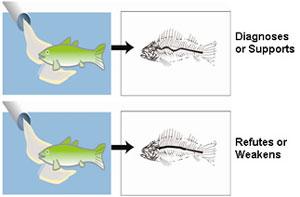 Figure 3-11. Symptoms Influence on the Case (Supports and Weakens)Observation of that symptom supports candidate causes that produce that symptom (e.g., selenium). If a known symptom is not observed, the case for the candidate cause is weakened.
Explanation of the Types of Evidence Illustrations
This description applies to each of the types of evidence illustrations. These illustrations provide graphic explanations of the types of evidence. They are somewhat abstract to convey that they are representative of the concept rather than illustrations of particular applications. The live fish (green and upright) represent unimpaired organisms, populations or communities of all types, not just fish. The dead fish (white and belly-up at the surface) represent all biological impairments, not just dead fish. The pipe represents all sources and the yellow effluent plume represents all causal agents (stressors), not just effluents or even chemicals. Clock faces represent the passage of time, not the particular time difference illustrated. Fish in beakers represent laboratory tests. Other graphic elements used in particular illustrations are explained in the caption.