Figures: Spatial/Temporal Co-occurrence
Figure 3-1a. Spatial/Temporal Co-occurrence with Upstream/Downstream Comparisons, Supports
The impairment (dead fish) occurs downstream of the source of the causal agent (effluent) but not upstream supports this case.
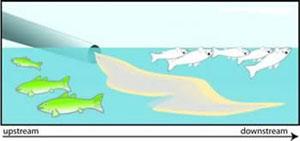 Figure 3-1a. Spatial/Temporal Co-occurrence with upstream/downstream comparisons illustrate how this supports the case.
Figure 3-1b. Spatial/Temporal Co-occurrence with Upstream/Downstream Comparisons, Weakens
The impairment (dead fish) occurs both upstream and downstream of the source of the causal agent (effluent) weakens this case.
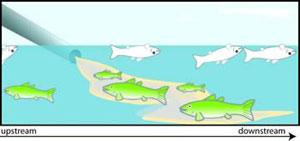 Figure 3-1b. Spatial/Temporal Co-occurrence with Upstream/Downstream Comparisons, Refutes
Additional Illustrations of Spatial/Temporal Co-occurrence are included below:
Figure 3-2a. Spatial/Temporal Co-occurrence with Positive Reference Sites, Supports
The impairment (dead fish) occurs in similar ecosystems exposed to the same causal agent (effluent from the same industry) at another site.
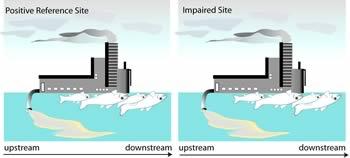 Figure 3-2a. Spatial/Temporal Co-occurrence with Positive Reference Sites, Supports the Case
Figure 3-2b. Spatial/Temporal Co-occurrence with Positive Reference Sites, Weakens
The impairment (dead fish) does not occur in similar ecosystems exposed to the same causal agent (effluent from the same industry) at another site.
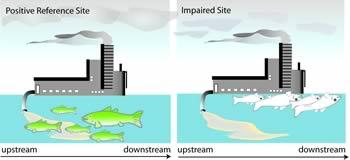 Figure 3-2b. Spatial/Temporal Co-occurrence with Positive Reference Sites, Weakens the Case
Figure 3-3a. Spatial/Temporal Co-occurrence Through Time at a Site, Supports
The impairment (dead fish) occurs when the causal agent occurs (the effluent is being discharged) but not when it does not occur (no discharge).
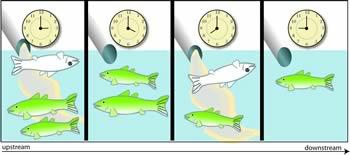 Figure 3-3a. Spatial/Temporal Co-occurrence Through Time at a Site, Supports the Case
Figure 3-3b. Spatial/Temporal Co-occurrence Through Time at a Site, Weakens
The impairment (dead fish) occurs whether the causal agent occurs (the effluent is being discharged) or not (no discharge).
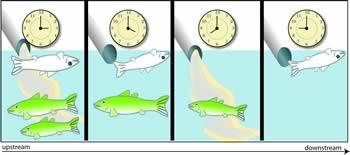 Figure 3-3b. Spatial/Temporal Co-occurrence Through Time at a Site, Weakens the Case
Explanation of the Types of Evidence Illustrations
This description applies to each of the types of evidence illustrations. These illustrations provide graphic explanations of the types of evidence. They are somewhat abstract to convey that they are representative of the concept rather than illustrations of particular applications. The live fish (green and upright) represent unimpaired organisms, populations or communities of all types, not just fish. The dead fish (white and belly-up at the surface) represent all biological impairments, not just dead fish. The pipe represents all sources and the yellow effluent plume represents all causal agents (stressors), not just effluents or even chemicals. Clock faces represent the passage of time, not the particular time difference illustrated. Fish in beakers represent laboratory tests. Other graphic elements used in particular illustrations are explained in the caption.