Climate Change Indicators: Cold-Related Deaths
This indicator presents data on deaths classified as “cold-related” in the United States.
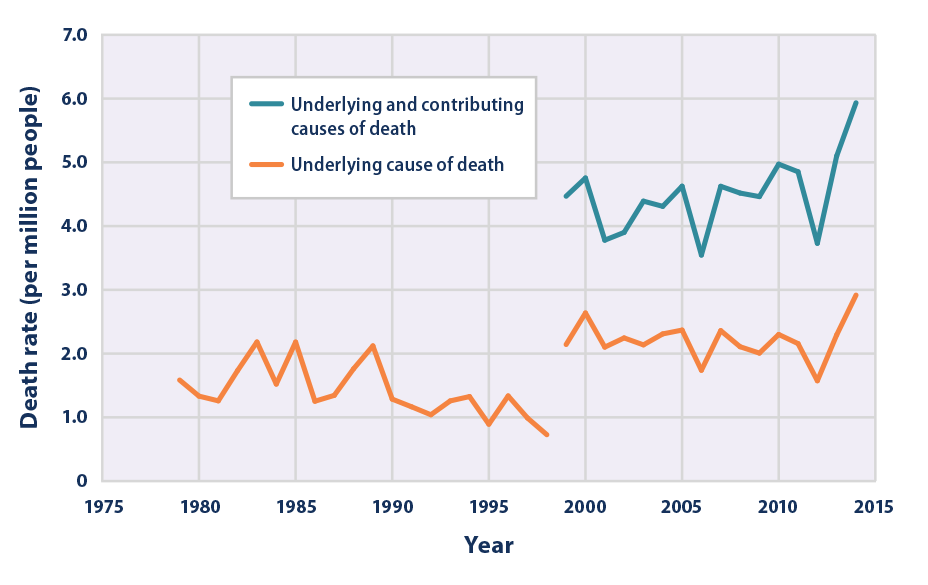
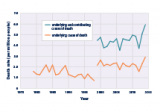
This figure shows the annual rates for deaths classified as “cold-related” by medical professionals in the 50 states and the District of Columbia. The orange line shows deaths for which cold was listed as the main (underlying) cause.* The blue line shows deaths for which cold was listed as either the underlying or contributing cause of death, based on a broader set of data that became available in 1999.
* Between 1998 and 1999, the World Health Organization revised the international codes used to classify causes of death. As a result, data from earlier than 1999 cannot easily be compared with data from 1999 and later.
Key Points
- Between 1979 and 2014, the death rate as a direct result of exposure to cold (underlying cause of death) generally ranged from 1 to 2.5 deaths per million people, with year-to-year fluctuations (see Figure 1). Overall, a total of more than 18,000 Americans have died from cold-related causes since 1979, according to death certificates.
- For years in which the two records overlap (1999–2014), accounting for those additional deaths in which cold was listed as a contributing factor results in a higher death rate—nearly double for some years—compared with the estimate that only includes deaths where cold was listed as the underlying cause (see Figure 1).
- While increases in deaths are generally associated with colder temperatures, some winter deaths are due to factors other than exposure to cold conditions. For example, winter is typically flu season. In other cases, even if cold exposure contributes to a death, it may not be reported as “cold-related” on a death certificate. These limitations, as well as year-to-year variability in the data and a change in classification codes in the late 1990s, make it difficult to determine whether the United States has experienced a meaningful increase or decrease in deaths classified as “cold-related” over time.
Background
In recent years, U.S. death rates in winter months have been 8 to 12 percent higher than in non-winter months.1 Much of this increase relates to seasonal changes in behavior and the human body, as well as increased exposure to respiratory diseases. Cold temperatures can also worsen pre-existing medical conditions such as cardiovascular and respiratory diseases. For example, death rates from heart attacks increase as temperatures drop, likely due to the way cold affects blood circulation, blood vessels, and other factors.2,3 Even moderately cold days can increase the risk of death for many people. People exposed to extremely cold conditions can also suffer from direct effects such as frostbite and potentially deadly hypothermia, especially in places where people are not accustomed to cold temperatures.
Certain population groups face higher risks of cold-related illness or death. For example, occupational groups that work outdoors during winter months, such as agricultural workers, construction workers, and electricity and pipeline utility workers, face higher risks of exposure to cold.4 Others at risk include older adults, infants, people with pre-existing medical conditions, people taking medications or using drugs (especially alcohol) that make them more susceptible to cold effects, homeless people, and those with inadequate winter clothing or home heating.5
Unusually cold winter temperatures have become less common across the contiguous 48 states in recent decades,6 particularly very cold nights (see the High and Low Temperatures indicator). Extreme cold waves are likely to continue to decrease as winter temperatures increase in the future.7 This winter warming is expected to reduce the number of direct cold-related deaths, but the decrease is projected to be smaller than increases in heat-related deaths (see the Heat-Related Deaths indicator) in most regions.8 This is because some of the factors that lead to higher death rates in the winter are not particularly sensitive to climate change,9 because extreme heat has a more immediate and direct effect on death rates than extreme cold,10 and because the solutions to protect against cold exposure (such as staying indoors, wearing more clothing, turning on the heat) are more widely accessible than protection against extreme heat.11 Cold-related death rates can change as communities strengthen their cold weather plans and take other steps to protect vulnerable people during cold winter months.
About the Indicator
This indicator shows the annual rate for deaths classified by medical professionals as “cold-related” in the United States based on death certificate records. Every death is recorded on a death certificate, where a medical professional identifies the main cause of death (also known as the underlying cause), along with other conditions that contributed to the death. These causes are classified using a set of standard codes. Dividing the annual number of deaths by the U.S. population in that year, then multiplying by one million, will result in the death rates (per million people) that this indicator shows.
Figure 1 shows cold-related death rates using two methods. One method shows deaths for which exposure to excessive natural cold was stated as the underlying cause of death from 1979 to 2014. The other data series shows deaths for which cold was listed as either the underlying cause or a contributing cause, based on a broader set of data that, at present, can only be evaluated back to 1999. For example, in a case where cardiovascular disease was determined to be the underlying cause of death, cold could be listed as a contributing factor because it can make the individual more susceptible to the effects of this disease. Because excessive cold events are associated with winter months, the 1999–2014 analysis was limited to October through April.
About the Data
Indicator Notes
Several factors influence the ability of this indicator to estimate the true number of deaths associated with exposure to cold temperatures. Some cold-related deaths are not identified as such by the medical examiner and might not be properly coded on the death certificate. In many cases, the medical examiner might classify the cause of death as a cardiovascular or respiratory disease, not knowing for certain whether cold was a contributing factor. Furthermore, deaths can occur from exposure to cold (either as an underlying cause or as a contributing factor) that is not classified as extreme and therefore is often not recorded as such. These factors are similar to the factors that likely lead to undercounting of heat-related deaths (see the Heat-Related Deaths indicator), except that the effects of cold on the body tend to persist for longer than the effects of heat,14 which could make it even more difficult to connect deaths to exposures.
Classifying a death as “cold-related” does not mean that cold temperatures were the only factor that caused or contributed to the death, as pre-existing medical conditions can significantly increase an individual’s susceptibility to cold temperatures. Other important factors, such as the overall vulnerability of the population, and the extent to which people have adapted and acclimated to cold temperatures, can also affect trends in cold-related deaths. Some deaths classified as “cold-related” reflect human behavior more than weather conditions—for instance, deaths in which alcohol abuse increased a person's susceptibility to cold weather, falling into cold water (which can cause hypothermia, even in non-winter months), or getting lost on a wilderness excursion. This indicator includes these types of deaths.
Data Sources
Data for this indicator were provided by the U.S. Centers for Disease Control and Prevention (CDC). The 1979–2014 underlying cause data in Figure 1 are publicly available through the CDC WONDER database at: http://wonder.cdc.gov/mortSQL.html. The 1999–2014 analysis in Figure 1 was developed by using data provided by CDC’s Environmental Public Health Tracking Program.
Technical Documentation
References
1. CDC (U.S. Centers for Disease Control and Prevention). 2017. CDC WONDER database: Compressed mortality file, underlying cause of death. Monthly all-cause mortality for 2011–2015. Accessed January 2017. http://wonder.cdc.gov/mortSQL.html.
2. Gasparrini, A., Y. Guo, M. Hashizume, E. Lavigne, A. Zanobetti, J. Schwartz, A. Tobias, S. Tong, J. Rocklöv, B. Forsberg, M. Leone, M. De Sario, M.L. Bell, Y.-L. Leon Guo, C.-F. Wu, H. Kan, S.-M. Yi, M. de Sousa Zanotti Stagliorio Coelho, P. Hilario Nascimento Saldiva, Y. Honda, H. Kim, and B. Armstrong. 2015. Mortality risk attributable to high and low ambient temperature: A multicountry observational study. The Lancet 386(9991):369–375.
3. Medina-Ramón, M., and J. Schwartz. 2007. Temperature, temperature extremes, and mortality: A study of acclimatization and effect modification in 50 U.S. cities. Occup. Environ. Med. 64(12):827–833.
4. Sarofim, M.C., S. Saha, M.D. Hawkins, D.M. Mills, J. Hess, R. Horton, P. Kinney, J. Schwartz, and A. St. Juliana. 2016. Chapter 2: Temperature-related death and illness. The impacts of climate change on human health in the United States: A scientific assessment. U.S. Global Change Research Program. https://health2016.globalchange.gov.
5. Berko, J., D.D. Ingram, S. Saha, and J.D. Parker, 2014: Deaths Attributed to Heat, Cold, and Other Weather Events in the United States, 2006–2010. National Health Statis¬tics Reports No. 76, July 30, 2014, 15 pp. National Center for Health Statistics, Hyattsville, MD. https://pubmed.ncbi.nlm.nih.gov/25073563
6. Melillo, J.M., T.C. Richmond, and G.W. Yohe (eds.). 2014. Climate change impacts in the United States: The third National Climate Assessment. U.S. Global Change Research Program. http://nca2014.globalchange.gov.
7. Melillo, J.M., T.C. Richmond, and G.W. Yohe (eds.). 2014. Climate change impacts in the United States: The third National Climate Assessment. U.S. Global Change Research Program. http://nca2014.globalchange.gov.
8. Sarofim, M.C., S. Saha, M.D. Hawkins, D.M. Mills, J. Hess, R. Horton, P. Kinney, J. Schwartz, and A. St. Juliana. 2016. Chapter 2: Temperature-related death and illness. The impacts of climate change on human health in the United States: A scientific assessment. U.S. Global Change Research Program. https://health2016.globalchange.gov.
9. Sarofim, M.C., S. Saha, M.D. Hawkins, D.M. Mills, J. Hess, R. Horton, P. Kinney, J. Schwartz, and A. St. Juliana. 2016. Chapter 2: Temperature-related death and illness. The impacts of climate change on human health in the United States: A scientific assessment. U.S. Global Change Research Program. https://health2016.globalchange.gov.
10. Sarofim, M.C., S. Saha, M.D. Hawkins, D.M. Mills, J. Hess, R. Horton, P. Kinney, J. Schwartz, and A. St. Juliana. 2016. Chapter 2: Temperature-related death and illness. The impacts of climate change on human health in the United States: A scientific assessment. U.S. Global Change Research Program. https://health2016.globalchange.gov.
11. Barnett, A.G., S..Hajat, A. Gasparrini, and J. Rocklöv. 2012. Cold and heat waves in the United States. Environmental Research 112:218–224.
12. CDC (U.S. Centers for Disease Control and Prevention). 2017. CDC WONDER database: Compressed mortality file, underlying cause of death. Accessed January 2017. http://wonder.cdc.gov/mortSQL.html.
13. CDC (U.S. Centers for Disease Control and Prevention). 2017. Monthly national totals provided by National Center for Environmental Health staff in January 2017, based on contributing causes of death with exclusion criteria applied.
14. Gasparrini, A., Y. Guo, M. Hashizume, E. Lavigne, A. Zanobetti, J. Schwartz, A. Tobias, S. Tong, J. Rocklöv, B. Forsberg, M. Leone, M. De Sario, M.L. Bell, Y.-L. Leon Guo, C.-F. Wu, H. Kan, S.-M. Yi, M. de Sousa Zanotti Stagliorio Coelho, P. Hilario Nascimento Saldiva, Y. Honda, H. Kim, and B. Armstrong. 2015. Mortality risk attributable to high and low ambient temperature: A multicountry observational study. The Lancet 386(9991):369–375.

