Climate Change Indicators: Ragweed Pollen Season
This indicator depicts changes in the length of ragweed pollen season in the United States and Canada.
-
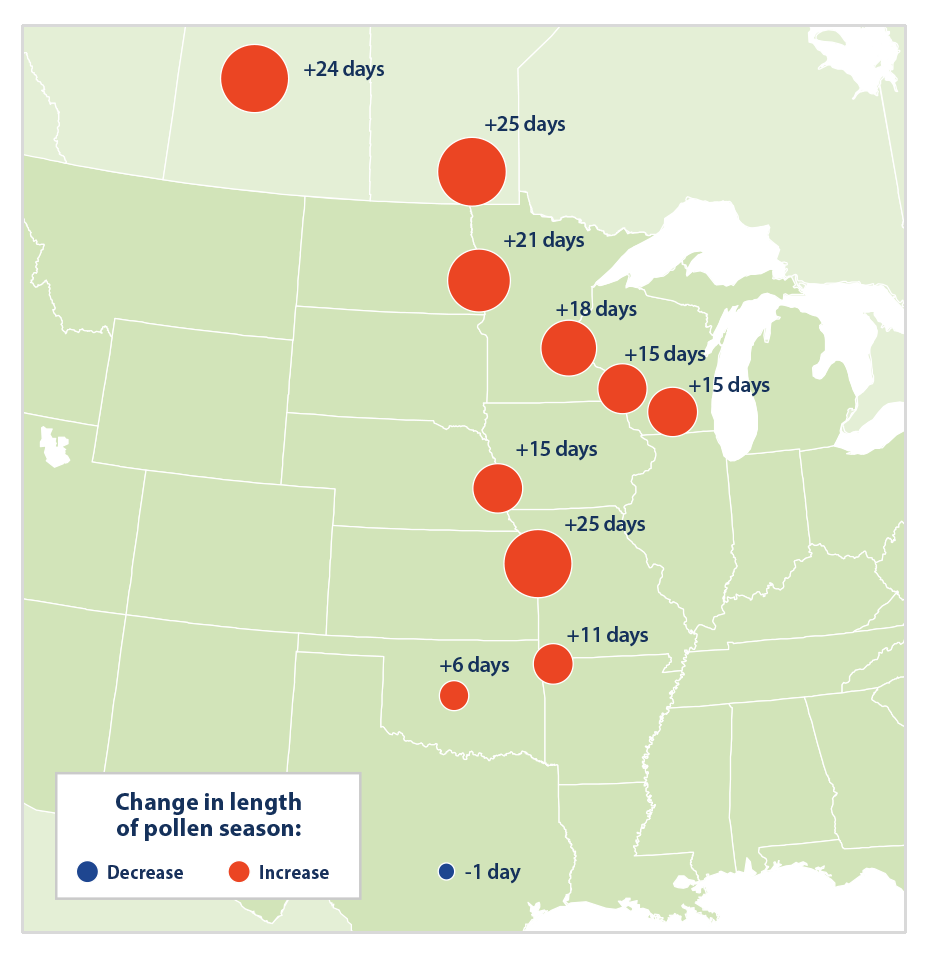
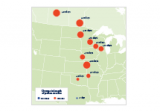
This figure shows how the length of ragweed pollen season changed at 11 locations in the central United States and Canada between 1995 and 2015. Red circles represent a longer pollen season; the blue circle represents a shorter season. Larger circles indicate larger changes.
Data source: Ziska et al., 20168
Web update: August 2016
Key Points
- Since 1995, ragweed pollen season has grown longer at 10 of the 11 locations studied (see Figure 1).
- The increase in ragweed season length generally becomes more pronounced from south to north. Ragweed season increased by 25 days in Winnipeg, Manitoba; 24 days in Saskatoon, Saskatchewan; 21 days in Fargo, North Dakota; and 18 days in Minneapolis, Minnesota (see Figure 1). This trend is consistent with many other observations showing that climate is changing more rapidly at higher latitudes.6
- The trends in Figure 1 are strongly related to changes in the length of the frost-free season and the timing of the first fall frost. Northern areas have seen fall frosts happening later than they used to, with the delay in first frost closely matching the increase in pollen season. Meanwhile, some southern stations have experienced only a modest change in frost-free season length since 1995.7
Background
Allergies are a major public health concern, with hay fever (congestion, runny nose, itchy eyes) accounting for more than 13 million visits to physicians’ offices and other medical facilities every year.1 One of the most common environmental allergens is ragweed, which can cause hay fever and trigger asthma attacks, especially in children and the elderly.2 An estimated 15.5 percent of all Americans are sensitive to ragweed.3
Ragweed plants mature in mid-summer and produce small flowers that generate pollen. Ragweed pollen season usually peaks in late summer and early fall, but these plants often continue to produce pollen until the first frost. A single ragweed plant can produce up to a billion pollen grains in one season, and these grains can be carried long distances by the wind.4
Climate change can affect pollen allergies in several ways. Warmer spring temperatures cause some plants to start producing pollen earlier (see the Leaf and Bloom Dates indicator), while warmer fall temperatures extend the growing season for other plants, such as ragweed (see the Length of Growing Season indicator). Warmer temperatures and increased carbon dioxide concentrations also enable ragweed and other plants to produce more allergenic pollen, in larger quantities. This means that many locations could experience longer allergy seasons and higher pollen counts as a result of climate change.5
About the Indicator
This indicator shows changes in the length of the ragweed pollen season in 11 cities in the central United States and Canada. These locations were selected as part of a study that looked at trends in pollen season at sites similar in elevation, but across a range of latitudes from south to north. At each location, air samples have been collected and examined since at least the 1990s as part of a national allergy monitoring network. Pollen spores are counted and identified using microscopes.
Pollen counts from each station have been analyzed to determine the start and end dates of each year’s ragweed pollen season. Because the length of ragweed season naturally varies from year to year, statistical techniques have been used to determine the average rate of change over time. This indicator shows the total change in season length from 1995 to 2015, which was determined by multiplying the average annual rate of change by the number of years in the period.
About the Data
Indicator Notes
This indicator is based on data from a limited number of cities in the central states and provinces. These cities cover a broad range from north to south, however, which allows researchers to establish a clear connection between pollen season changes and latitude.
Many factors can influence year-to-year changes in pollen season, including typical local and regional variations in temperature and precipitation, extreme events such as floods and droughts, and changes in plant diversity. In addition, seasonal pollen production may differ between stations located in densely urbanized areas and stations in outlying areas. Adding more years of data would provide a better picture of long-term trends, but widespread data were not available prior to 1995.
This indicator does not show how the intensity of ragweed pollen season (pollen counts) might also be changing.
Data Sources
Data for this indicator come from the National Allergy Bureau, which is part of the American Academy of Allergy, Asthma, and Immunology’s Aeroallergen Network. Data were compiled and analyzed by a team of researchers that published a more detailed version of this analysis in a scientific journal with data through 2009.9
Technical Documentation
References
1 Schappert, S.M., and E.A. Rechtsteiner. 2011. Ambulatory medical care utilization estimates for 2007. National Center for Health Statistics. Vital and Health Statistics 13(169). www.cdc.gov/nchs/data/series/sr_13/sr13_169.pdf.
2 Fann, N., T. Brennan, P. Dolwick, J.L. Gamble, V. Ilacqua, L. Kolb, C.G. Nolte, T.L. Spero, and L. Ziska, 2016. Chapter 3: Air quality impacts. The impacts of climate change on human health in the United States: A scientific assessment. U.S. Global Change Research Program. https://health2016.globalchange.gov.
3 Salo, P.M., S.J. Arbes, Jr., R. Jaramillo, A. Calatroni, C.H. Weir, M.L. Sever, J.A. Hoppin, K.M. Rose, A.H. Liu, P.J. Gergen, H.E. Mitchell, and D.C. Zeldin. 2014. Prevalence of allergic sensitization in the United States: Results from the National Health and Nutrition Examination Survey (NHANES) 2005–2006. J. Allergy Clin. Immun. 134(2):350–359. See online data repository.
4 National Institute of Allergy and Infectious Diseases. 2011. Pollen allergy. www.niaid.nih.gov/topics/allergicdiseases/documents/pollenallergyfactsheet.pdf.
5 Fann, N., T. Brennan, P. Dolwick, J.L. Gamble, V. Ilacqua, L. Kolb, C.G. Nolte, T.L. Spero, and L. Ziska, 2016. Chapter 3: Air quality impacts. The impacts of climate change on human health in the United States: A scientific assessment. U.S. Global Change Research Program. https://health2016.globalchange.gov.
6 IPCC (Intergovernmental Panel on Climate Change). 2013. Climate change 2013: The physical science basis. Working Group I contribution to the IPCC Fifth Assessment Report. Cambridge, United Kingdom: Cambridge University Press. www.ipcc.ch/report/ar5/wg1.
7 Ziska, L., K. Knowlton, C. Rogers, D. Dalan, N. Tierney, M. Elder, W. Filley, J. Shropshire, L.B. Ford, C. Hedberg, P. Fleetwood, K.T. Hovanky, T. Kavanaugh, G. Fulford, R.F. Vrtis, J.A. Patz, J. Portnoy, F. Coates, L. Bielory, and D. Frenz. 2011. Recent warming by latitude associated with increased length of ragweed pollen season in central North America. P Natl. Acad. Sci. USA 108:4248–4251.
8 Ziska, L., K. Knowlton, C. Rogers, National Allergy Bureau, Aerobiology Research Laboratories, Canada. 2016 update to data originally published in: Ziska, L., K. Knowlton, C. Rogers, D. Dalan, N. Tierney, M. Elder, W. Filley, J. Shropshire, L.B. Ford, C. Hedberg, P. Fleetwood, K.T. Hovanky, T. Kavanaugh, G. Fulford, R.F. Vrtis, J.A. Patz, J. Portnoy, F. Coates, L. Bielory, and D. Frenz. 2011. Recent warming by latitude associated with increased length of ragweed pollen season in central North America. P Natl. Acad. Sci. USA 108:4248–4251.
9 Ziska, L., K. Knowlton, C. Rogers, D. Dalan, N. Tierney, M. Elder, W. Filley, J. Shropshire, L.B. Ford, C. Hedberg, P. Fleetwood, K.T. Hovanky, T. Kavanaugh, G. Fulford, R.F. Vrtis, J.A. Patz, J. Portnoy, F. Coates, L. Bielory, and D. Frenz. 2011. Recent warming by latitude associated with increased length of ragweed pollen season in central North America. P Natl. Acad. Sci. USA 108:4248–4251.

