Climate Change Indicators: U.S. Greenhouse Gas Emissions
This indicator describes emissions of greenhouse gases in the United States.
-


This figure shows emissions of carbon dioxide, methane, nitrous oxide, and several fluorinated gases in the United States from 1990 to 2014. For consistency, emissions are expressed in million metric tons of carbon dioxide equivalents.
* HFCs are hydrofluorocarbons, PFCs are perfluorocarbons, SF6 is sulfur hexafluoride, and NF3 is nitrogen trifluoride.
Data source: U.S. EPA, 20164
Web update: August 2016 -

This figure shows greenhouse gas emissions and sinks (negative values) by source in the United States from 1990 to 2014. For consistency, emissions are expressed in million metric tons of carbon dioxide equivalents. All electric power emissions are grouped together in the “Electricity generation” sector, so other sectors such as “Residential” and “Commercial” are only showing non-electric sources, such as burning oil or gas for heating. Totals do not match Figure 1 exactly because the economic sectors shown here do not include emissions from U.S. territories outside the 50 states.
Data source: U.S. EPA, 20165
Web update: August 2016 -

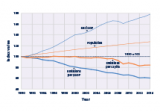
This figure shows trends in greenhouse gas emissions from 1990 to 2014 per capita (heavy orange line), based on the total U.S. population (thin orange line). It also shows trends in emissions per dollar of real GDP (heavy blue line). Real GDP (thin blue line) is the value of all goods and services produced in the country during a given year, adjusted for inflation. All data are indexed to 1990 as the base year, which is assigned a value of 100. For instance, a real GDP value of 178 in the year 2014 would represent a 78 percent increase since 1990.
Data source: U.S. EPA, 20166
Web update: August 2016


Key Points
- In 2014, U.S. greenhouse gas emissions totaled 6,870 million metric tons (15.1 trillion pounds) of carbon dioxide equivalents. This total represents a 7 percent increase since 1990 but a 7 percent decrease since 2005 (see Figure 1).
- For the United States, during the period from 1990 to 2014 (see Figure 1):
- Emissions of carbon dioxide, the primary greenhouse gas emitted by human activities, increased by 9 percent.
- Methane emissions decreased by 6 percent, as reduced emissions from landfills, coal mines, and natural gas systems more than offset increases in emissions from activities such as livestock production.2
- Nitrous oxide emissions, predominantly from agricultural soil management practices such as the use of nitrogen as a fertilizer, decreased by 1 percent.
- Emissions of fluorinated gases (hydrofluorocarbons, perfluorocarbons, sulfur hexafluoride, and nitrogen trifluoride), released as a result of commercial, industrial, and household uses, increased by 77 percent.
- Among the various sectors of the U.S. economy, electricity generation (power plants) accounts for the largest share of emissions—31 percent of total greenhouse gas emissions since 1990. Transportation is the second-largest sector, accounting for 26 percent of emissions since 1990 (see Figure 2).
- Emissions sinks, the opposite of emissions sources, absorb carbon dioxide from the atmosphere. In 2014, 11 percent of U.S. greenhouse gas emissions were offset by net sinks resulting from land use and forestry practices (see Figure 2). One major sink is the net growth of forests, which remove carbon from the atmosphere. Other carbon sinks are associated with how people use the land, including the practice of depositing yard trimmings and food scraps in landfills. While the land use, land-use change, and forestry category represents an overall net sink of carbon dioxide in the United States, this category also includes emission sources resulting from activities such as wildfires, converting land to cropland, and biomass burning.
- Emissions increased at about the same rate as the population from 1990 to 2007, which caused emissions per capita to remain fairly level (see Figure 3). Total emissions and emissions per capita declined from 2007 to 2009, due in part to a drop in U.S. economic production during this time. Emissions decreased again from 2010 to 2012, largely due to the growing use of natural gas to generate electricity in place of more carbon-intensive fuels.3
- From 1990 to 2014, greenhouse gas emissions per dollar of goods and services produced by the U.S. economy (the gross domestic product or GDP) declined by 40 percent (see Figure 3). This change may reflect a combination of increased energy efficiency and structural changes in the economy.
Background
A number of factors influence the quantities of greenhouse gases released into the atmosphere, including economic activity, population, consumption patterns, energy prices, land use, and technology. There are several ways to track these emissions, such as by measuring emissions directly, calculating emissions based on the amount of fuel that people burn, and estimating other activities and their associated emissions. EPA has two key programs that provide data on greenhouse gas emissions in the United States: the Inventory of U.S. Greenhouse Gas Emissions and Sinks and the Greenhouse Gas Reporting Program. See “Sources of Data on U.S. Greenhouse Gas Emissions” to learn more about these programs.
About the Indicator
This indicator focuses on emissions of carbon dioxide, methane, nitrous oxide, and several fluorinated gases—all important greenhouse gases that are influenced by human activities. These particular gases are covered under the United Nations Framework Convention on Climate Change, an international agreement that requires participating countries to develop and periodically submit an inventory of greenhouse gas emissions. Data and analysis for this indicator come from EPA’s annual inventory submission, the Inventory of U.S. Greenhouse Gas Emissions and Sinks: 1990–2014.1 This indicator is restricted to emissions associated with human activities. It starts in 1990, which is a common baseline year for global agreements to track and reduce greenhouse gas emissions.
Each greenhouse gas has a different lifetime (how long it stays in the atmosphere) and a different ability to trap heat in our atmosphere. To allow different gases to be compared and added together, emissions are converted into carbon dioxide equivalents. This step uses each gas’s 100-year global warming potential, which measures how much a given amount of the gas is estimated to contribute to global warming over a period of 100 years after being emitted. Carbon dioxide is assigned a global warming potential equal to 1. This analysis uses global warming potentials from the Intergovernmental Panel on Climate Change’s (IPCC’s) Fourth Assessment Report. In that report, methane has a global warming potential of 25, which means a ton of methane emissions contributes 25 times as much warming as a ton of carbon dioxide emissions over 100 years, and that ton of methane emissions is therefore equal to 25 tons of carbon dioxide equivalents. See the table for comparison with global warming potentials from IPCC’s Fifth Assessment Report. For additional perspective, this indicator also shows greenhouse gas emissions in relation to economic output and population.
About the Data
Indicator Notes
While this indicator includes the major greenhouse gases emitted by human activities, it does not include other greenhouse gases and substances that are not covered under the United Nations Framework Convention on Climate Change but that still affect the Earth’s energy balance and climate (see the Climate Forcing indicator for more details). For example, this indicator excludes ozone-depleting substances such as chlorofluorocarbons (CFCs) and hydrochlorofluorocarbons (HCFCs), which have high global warming potentials, as these gases have been or are currently being phased out under an international agreement called the Montreal Protocol. This indicator also excludes black carbon and aerosols, which most greenhouse gas emissions inventories do not cover. There are also many natural greenhouse gas emissions sources; however, this indicator focuses on emissions that are associated with human activities—those that are most responsible for the observed buildup of these gases in our atmosphere. Although the land use, land-use change, and forestry emission estimates include emissions and sinks from unmanaged lands due to forest growth, fires, and other factors, this indicator does not include other natural sources such as methane emissions from unmanaged wetlands.
Data Sources
Data for this indicator came from EPA’s Inventory of U.S. Greenhouse Gas Emissions and Sinks: 1990–2014. This report is available online at: https://19january2021snapshot.epa.gov/ghgemissions/us-greenhouse-gas-inventory-report-1990-2014. The calculations in Figure 3 are based on GDP and population data provided by the U.S. Bureau of Economic Analysis and the U.S. Census, respectively.
Technical Documentation
References
1. U.S. EPA (U.S. Environmental Protection Agency). 2016. Inventory of U.S. greenhouse gas emissions and sinks: 1990–2014. EPA 430-R-16-002. www.epa.gov/climatechange/ghgemissions/usinventoryreport.html.
2. U.S. EPA (U.S. Environmental Protection Agency). 2016. Inventory of U.S. greenhouse gas emissions and sinks: 1990–2014. EPA 430-R-16-002. www.epa.gov/climatechange/ghgemissions/usinventoryreport.html.
3. U.S. EPA (U.S. Environmental Protection Agency). 2016. Inventory of U.S. greenhouse gas emissions and sinks: 1990–2014. EPA 430-R-16-002. www.epa.gov/climatechange/ghgemissions/usinventoryreport.html.
4. U.S. EPA (U.S. Environmental Protection Agency). 2016. Inventory of U.S. greenhouse gas emissions and sinks: 1990–2014. EPA 430-R-16-002. www.epa.gov/climatechange/ghgemissions/usinventoryreport.html.
5. U.S. EPA (U.S. Environmental Protection Agency). 2016. Inventory of U.S. greenhouse gas emissions and sinks: 1990–2014. EPA 430-R-16-002. www.epa.gov/climatechange/ghgemissions/usinventoryreport.html.
6. U.S. EPA (U.S. Environmental Protection Agency). 2016. Inventory of U.S. greenhouse gas emissions and sinks: 1990–2014. EPA 430-R-16-002. www.epa.gov/climatechange/ghgemissions/usinventoryreport.html.