About the Data
EnviroAtlas provides data at the U.S. national extent and at higher resolution for selected populated places.
- Most maps at the national extent provide wall-to-wall data coverage for the contiguous U.S. as well as some data for Alaska, Hawaii, Puerto Rico and the Virgin Islands.
- Finer-scale data for selected populated places in EnviroAtlas draw from meter scale urban land cover data, census data, and models.
- Learn more about our approach to data development.
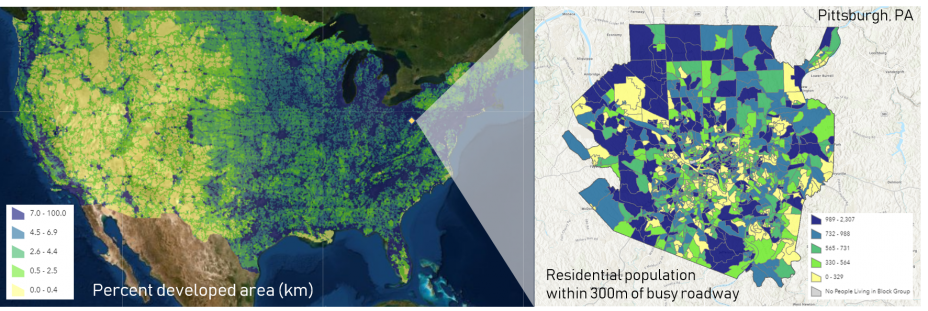 Example images showing EnviroAtlas spatial extents. National data (left) are aggregated to 12-digit HUCs, while high-resolution data (right) are aggregated to census block groups.
National Data
- Most maps at the national extent provide wall-to-wall data coverage for the contiguous U.S. as well as some data for Alaska, Hawaii, Puerto Rico and the Virgin Islands. There are approximately 300 data layers at this extent.
- Many of these data layers are summarized by 12-digit hydrologic unit codes (12-digit HUCs), or sub-watershed basins, and provide approximately 90,000 similarly sized spatial units. Many of these data layers are derived from data with a resolution of 30 m.
- Ecosystem Markets data layers are available for the nation, showing point and polygon data for ecosystem market initiatives and enabling conditions operating at a variety of scales, from national to local.
Populated Places at High Resolution
- Higher resolution data in EnviroAtlas draws from meter scale urban land cover data, census data, and models. There are approximately 100 data layers per area.
- These fine-scale data are consistent for each available populated place, and they are mostly summarized by census block groups.
- Many of the boundaries for community areas are based on selected block groups within the 2010 US Census Urban Area boundary.
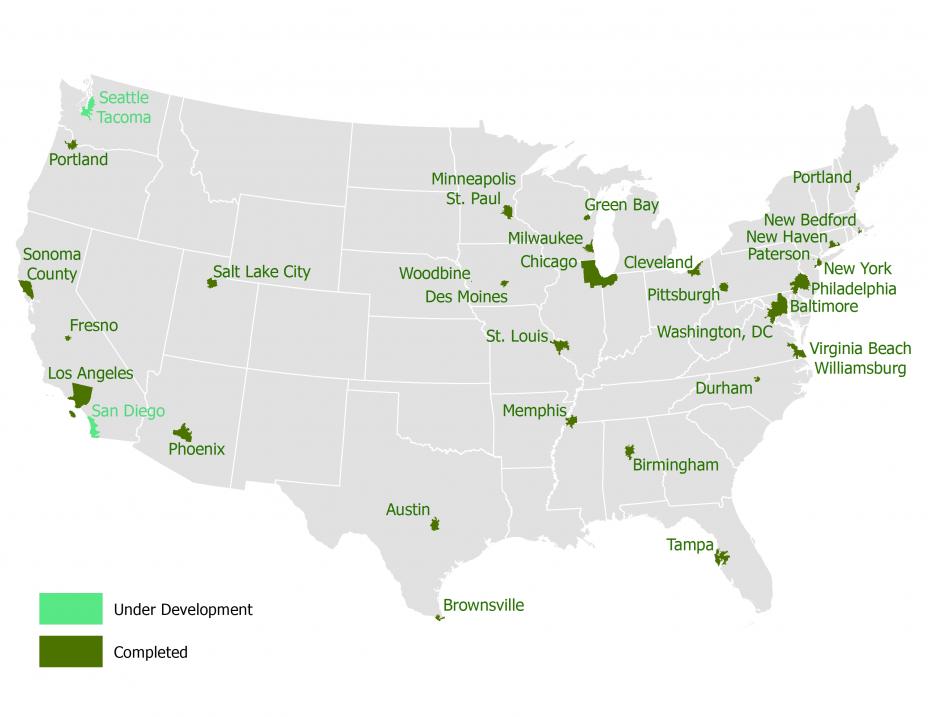
- EnviroAtlas currently includes fine-scale data for more than 1400 cities and towns centered on 30 U.S. urbanized community areas (shown in the map below). See a list of the municipalities that have available high-resolution data.
 These areas were selected based on:
- geography,
- ongoing local research,
- data availability,
- and opportunities to leverage other EPA projects.
EnviroAtlas Relies on Foundational Data
- The development of indicators relies on the availability of nationally and locally available data sets which provide inputs to models and calculations.
- EnviroAtlas supports the development of some data sets that provide important inputs.
 In downtown Milwaukee, WI (1:6000), the 30m NLCD dataset (left) presents a coarse, pixelated picture with a majority of developed (red) land cover. By contrast, the 1m EnviroAtlas community data (right) provides a clearer picture that reveals more natural land cover, such as water (blue) and trees (dark green).
- Land cover, for example, is a critical data set that is necessary for the computation of many of the EnviroAtlas data layers.
- EnviroAtlas supports the development of the National Land Cover Dataset (NLCD)EXIT, a 30 meter resolution product.
- We also develop the high resolution land cover, a 1 meter resolution product, that is used for the selected communities.
- For investigating changes over time, it is important to have land cover data available for multiple time periods.
- NLCD is produced every 5 years.
- Other data sets such as stream hydrography, soils, demographics, topography, and economic data, in combination with land cover, are used to produce our indicators.