Step 3: Select and Weight Relevant Indicators
 Next step is selection and weighting of relevant indicators… meaning, in this case, relevant to the screening purpose. You should always put some time into available indicator review before you begin a screening. Within the RPS Tool itself are descriptions of every existing indicator ready for use and a tool for exploring statistical properties of individual indicators. In this website are more detailed reference materials about different watershed indicators, including those in the Tool and many others that may be available from user data. The description below focuses mainly on considering and selecting indicators from those already in the RPS Tool.
On this page:
- Indicator basics
- Indicator Info tab descriptions
- “Explore Indicator Data” function
- Indicator reference resources
- Adding new indicator data
- Assigning indicator weights
Indicator Basics
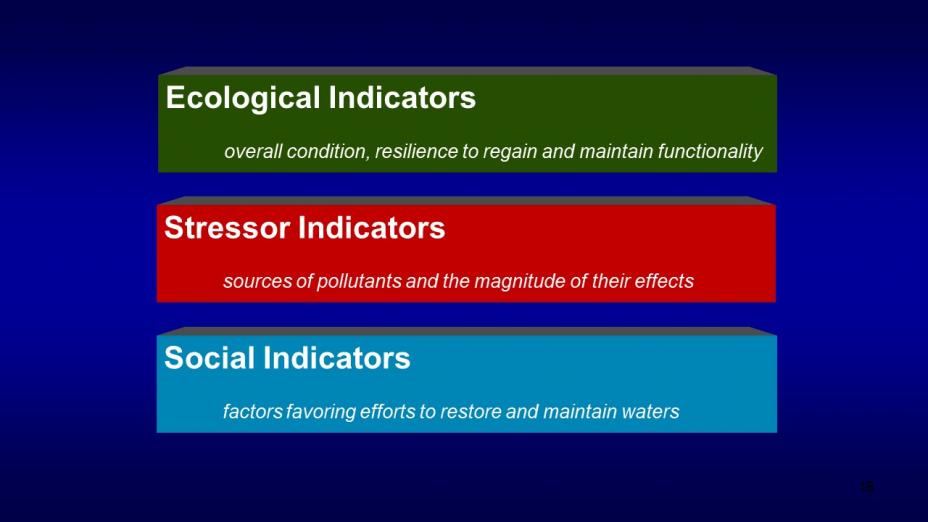
RPS Tool indicators are organized in three major categories - ecological, stressor and social - based on three main mechanisms by which natural and human-made driving factors influence watershed condition and its management. Ecological indicators measure those properties that are related to current watershed condition and the capacity to maintain or reestablish natural structure and processes. Stressor indicators are associated with reduced natural function due to the negative impacts of pollutants and other stressors. Social indicators address a broad array of community, regulatory, economic and behavioral measures that often have a profound influence on watershed management approaches and restoration success independent of the environmental factors.
Indicator selection should assemble a collection of relevant factors that each provide a different 'piece of the puzzle' within the three indicator categories. Subcategories of the ecological, stressor and social categories and example indicators for each are provided at the indicators overview page to encourage a diverse selection of indicators. It may not be possible to obtain data on all the factors you'd like to measure, or to have an indicator from every subcategory, but every effort should be made to use indicators that are not all related to the same subcategory (e.g., ecological indicator selection should include more than just different measurements of watershed land cover.)
Indicator Info Tab Descriptions
The quickest way to find indicator descriptions while setting up a screening is within the Tool itself. Each RPS Tool’s INDICATOR INFO tab summarizes every indicator name, category, scale and description (data source, how measured and basic meaning of the metric) in a quick reference table within the Tool. More details about using the INDICATOR INFO tab while setting up a screening are available at RPS Training and User Support.
“Explore Indicator Data” Function
Also within the Tool itself is a way to explore common statistics and distributional properties of the data itself for any indicator being considered for use. On the RPS Tool’s DATA tab (in most cases the HUC12_DATA tab) is the “Explore Indicator Data” function, organized as follows: at the top, you select the indicator and which group of watersheds you want to compare. The middle panel has three tabs that display indicator value distribution, ecoregional variation, and correlation among selected indicators, each with a set of common statistical parameters in the bottom panel. Detailed training on using this function to look more closely at candidate indicators can be found at RPS Training and User Support.
Indicator Reference Resources
Supplementing the quick reference and data exploration options within the Tool is an extensive set of background reference materials online. These materials are not specific to the exact indicators and geographic area covered in a specific RPS Tool. Rather, they are oriented toward describing more of the background about these indicators and generally how the indicator may be relevant to degrading, restoring or maintaining watershed condition based on literature and practice. Reference information on recovery potential indicators is available through this website in the form of
- a literature database
- available indicators lists and summaries, and
- indicator-specific reference sheets:
Go to RPS Ecological Indicator Reference Sheets
Adding new indicator data
After reviewing lists and definitions of available indicators, RPS users sometimes decide that they have additional data and can compile more new indicators that will make their screening results better. Brainstorming new indicators worth adding is best done in an informal group discussion involving those most familiar with the area's water bodies, impairment types, and restoration track record to date. Although it can be time-consuming to compile additional indicators, local or state-specific data sources often include key parameters (such as bioassessment datasets) that haven’t been possible to compile nationally. General information on Developing New RPS Indicators and RPS Indicator Scoring Techniques should be consulted to be sure new indicators will be fully consistent with existing data. Specialized training on indicator categories and the process of adding new indicators via the ADD INDICATORS tab is available at RPS Training and User Support.
Assigning indicator weights
While settling in on the most appropriate selection of indicators for your screening, it may be a good time to think also about assigning different weights to them. The setup process within the Tool defaults to equally weighted indicators, but provides an easy opportunity to change weighting on any indicator before every screening run. You may (and actually should) change the default weights based on any expert insights or information you may have. Typically, some indicators are clearly more important than others for any given purpose. If nothing else, assigning weights of 3, 2, or 1 (implying high, medium, low) based on your expert judgement is recommended over leaving indicators equally weighted.