Step 7: Refine and Re-Screen Iteratively, then Use Your Results
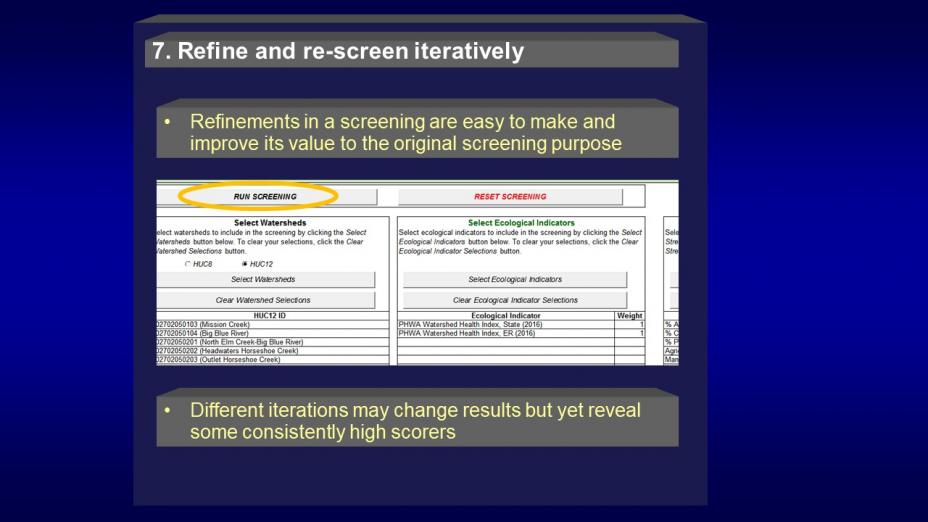 At this point, you now can carry out different variations on your original screening run through quick and easy manipulations of the RPS Tool SETUP tab or apply entirely new approaches based on what earlier screening efforts may have revealed. You can vary these screening runs iteratively by selecting new combinations of indicators or by weighting existing indicators differently. You’ve learned the basic process from the preceding steps, so there’s no need for repetition here – but it is time to decide how you’d like to apply multiple screening results to their original purpose.
On this page:
- Revisit screening purpose and products
- Integrate the screening runs
- Match screening outputs to actions
- Use Your Results!
Revisit screening purpose and products
It is not unusual for an RPS project to begin with a very general goal, such as 'identify restorability differences' and refine or even change that goal as screening steps proceed. For example, an original plan such as 'identify and target the most restorable watersheds for restoration' might have evolved into 'identify the watersheds that have good RPI scores as well as moderately heavy nutrient loads and target these for TMDL implementation'. An originally single goal may also have transformed into multiple, more specific goals, such as 'target watersheds for CWA Section 319 nonpoint source projects that have impairments and a high social index score', 'target watersheds with pathogen TMDLs as well as nearby drinking water intakes for expedited restoration', and 'target watersheds with impaired but restorable aquatic habitats for collaborative restoration with fisheries programs'. Because creating alternative screening runs is so easy, having multiple goals is not a problem unless it is necessary to narrow them down to one. In such a case, a close look at the outputs of screening runs designed to address each goal may help inform the selection process.
Some considerations for revisiting purpose and products include:
- Has the original screening purpose remained the same?
- Will the originally planned screening approach and indicators still meet the intended purpose?
- Have new goals or purposes emerged during the screening process, and do indicators and screening runs exist that address them?
- Will the products of the screening identify or compare waters or watersheds by way of a transparent, reproducible process?
- Will interim screening results help inform any needed decisions or strategies?
- Will specific products help in communicating decisions or strategies?
If these questions reveal additional data or screening needs, you can revisit earlier steps to fill those gaps. If they point instead to sufficient data with a need to choose among your existing screening results, you can proceed as follows.
Integrate the screening runs
After conducting multiple screening runs and revisiting the scoring process, it is possible that you may have multiple versions that identify different sets of watersheds as more restorable. On the other hand, it is likely that you have observed some degree of consistency or pattern in the results - variations in indicator selection and weights often still point to many of the same watersheds as high-scoring. The opportunity to explore different combinations of indicators has been informative, but your challenge now is to distill your findings into the form you will need to inform and support action. This is a project-specific task without a single, universal solution for all settings; nevertheless, the following approaches may suit your circumstances:
- Select the preferred screening run. Refining repeatedly and reaching consensus on one screening run may be preferable to evaluating many alternatives. Preferences for one (or very few) of the screening runs and indicator selections sometimes emerge, when clearly consistent with expert judgment and familiarity with the area being assessed. Or, intensive discussions of preferred indicators that are strongly associated with the screening purpose may lead to confidence in just one screening. Selection of a specific screening run should consider the source and indicator data quality, the evaluation of its component indicators against reference sites, and how well the screening run addresses the assessment purposes and products.
- Integrate multiple screening runs if necessary. Should you feel that no single run is ideal, consider integrating the results of the best runs available. Averaging or summing indicator scores of multiple runs are ways to combine results. Further, it is possible to combine the results from multiple screening runs with the results of an entirely independent prioritization process. Yet another approach involves targeting watersheds that surpass a defined set of scoring threshold (e.g., all watersheds with highest quartile ecological scores, lowest quartile stressor scores and above-mean social context scores in three of five screening runs). Other statistical methods may provide a systematic, repeatable way to vary the combinations of indicators in multiple screening runs and observe the watersheds that consistently score well.
- Maintain multiple alternatives intentionally. Sometimes the most useful output is, in fact, multiple sets of results rather than one. An assessment designed to assist a complex decision-making process, for example, might intentionally not select or rank-order specific watersheds but instead provide a few well documented alternatives to decision-makers for their final action. Different screenings could also reflect contingency plans for different budget scenarios, or different priority watershed selections for collaboration with different program partners. If your screening approach involved subsets such as separately screening lake and stream watersheds, or screening the three most common impairments separately, maintaining and using multiple sets of results is appropriate.
Match screening outputs to actions
Reconciling several alternative screening runs may have clarified the outcome of your screening assessment while not yet providing the specifics you require - usually a subset of the screened watersheds that is specifically matched to an intended action. Again, screening goals and project circumstances can vary so widely that making final selections is a project-specific task. The following are some simple options that use different RPS products to target selected watersheds:
- Select a defined portion from rank-ordered screening results. Resource-limited programs often are aware of their capacity in terms of yearly number of projects, funding available or other measures. It is possible to match annual or long-term capacity estimates to rank-ordered screening scores in identifying priorities for restoration. Alternatively, prioritization might use rank-ordered sites more generally (such as 'within the top quartile RPI score' or 'ranking above the state mean in ecological and social index score') or in combination with other qualifying factors (such as 'also an Environmental Justice area' or 'needing three projects per sub-state region'). It is also possible to avoid selecting a priority subset at all, and use the complete set of rank-ordered recovery potential scores purely to inform day-to-day activities on the likely level of effort and related factors that may be expected if working on a given location.
- Use bubble plot quadrants to help select priorities. Step 5 discussed how bubble plot median axes bisect the plot in horizontal and vertical dimensions, thereby creating quadrants that offer a basis for different types of prioritization strategies. Selecting the upper left quadrant, for example, would target all watersheds with ecological and stressor scores better than the median. The upper right quadrant, on the other hand, might be selected if priorities lean toward high ecological scores paired with elevated and potentially threatening stressor scores. The lower right quadrant, where high stressor and low ecological scores converge, would be a place where potentially more expensive and complex restoration challenges could be found. In any of the above, prioritizing the larger 'bubbles' within the selected quadrant would specifically target better social context for restoration as well.
- Use geographic and scoring factors together. If geographic proximity-based factors like 'adjacency to green infrastructure hub or corridor' were not already included in the screening indicators, selection of priorities might also include a mapping component. Prioritization might start with rank-ordering or bubble plot quadrants as above, then target further with geographically observable factors. For example, impaired watershed priorities might include watersheds in the best quartile based on RPI score but also contiguous with a larger patch or corridor of healthy watersheds. Another approach might prioritize restoring specific impaired watersheds to expand the downstream extent of healthy headwaters above highly significant and economically valuable water bodies.
Use Your Results!
A remarkable variety of different interests, user groups and publicly and privately run programs are involved in restoration and protection of US waters and watersheds. Recovery Potential Screening was originally developed as a technical approach for arranging Clean Water Act (CWA) Section 303(d)-listed impaired waters in a prioritized schedule for Total Maximum Daily Load (TMDL) development and restoration. As a flexible yet systematic framework in a moderately easy to use tool, RPS has proven applicable within and well beyond traditional water programs. In addition to impaired waters programs at local, state or national level, other applications include fisheries management and restoration, non-point source control grants, green infrastructure and healthy watersheds planning, river basin plan development, rural and urban environmental justice programs, urban watershed restoration strategies and priority-setting in public lands management. Across these varied interests, example uses for screening assessment results include:
- Identify relative differences in restorability among all watersheds and related factors, to better anticipate restoration workloads from place to place.
- Identify the more restorable watersheds as an aid to decision makers.
- Identify, among watersheds with heavy pollutant loads, the healthier watersheds where substantial load reduction could still be accomplished.
- Help prioritize the CWA section 303(d) list schedule for TMDL development.
- Target or prioritize implementation of existing TMDLs for promising watersheds.
- Evaluate where best to make CWA section 319 (nonpoint source control) or other restoration investments.
- Target monitoring where ongoing recoveries appear more likely.
- Establish a baseline for studying future recovery patterns.
- Identify where impaired watershed restoration and healthy watershed protection efforts can have great synergy.
- Influence restoration partnering site selection based on social context scores.
- Coordinate with major groups or agencies who carry out restoration themselves.
- Provide a transparent, systematic basis for restoration decisions and priorities.