Step 4: Run the First Screening and Check the Results
 After Step 3, you’ve completed preparations sufficient to meet the demands of your screening purpose. The best news is, most of the work is done at this point. The greatest effort already occurred while you defined the screening purpose and desired outputs, selected a project area and watershed units to compare, focused in on a subset of highest interest, evaluated candidate indicators and weights and possibly customized your tool with new indicator data. Now you can set up your screening and view your initial set of results in just a few additional minutes of work.
On this page:
QA/QC for customized RPS Tools
If you are using a State-specific RPS Tool without any modifications, its data and its functionality as a tool have already been quality-assured before finalization. If you customized your RPS Tool with additional data or developed subsets to focus your screening on, however, this is an essential time to QA/QC your modified tool to ensure that you have not introduced errors. It is useful to double-check the following:
- File renaming. Whether or not you have modified the RPS Tool from the version that you downloaded, it must be renamed to ensure that you can distinguish the copy with screening results (that you will soon create) from an unused copy of the Tool file. It is best to use a naming convention that provides some indication of location, date created and screening purpose. You should be renaming this file for each screening run that you wish to save, so consider an efficient naming process in advance.
- Geographic Completeness. It is necessary to check on whether the project area chosen in Step 1 is completely covered in the Tool you have. State-specific RPS Tools contain every HUC12 watershed that is fully or partially within the state; for the partially in-state HUC12s, the whole watersheds are included in the data (not just the in-state portion). Further, if you are using a subset instead of all watersheds in your tool, you may wish to verify that the subset includes what was intended.
- Indicator Completeness. If you have added indicator data via the ADD INDICATORS tab, check the Tool’s data table and be sure that each indicator has been added in the right category (Base, Ecological, Stressor, Social). Also, be sure to note whether you have manually added these new indicator names and their definitions to the INDICATOR INFO tab – adding the data to the data table alone doesn’t provide this important metadata about it.
- Availability. If you have added indicators correctly, their names will appear in the end of each of the drop-down menus on the SETUP tab -- in the correct category. If they do not appear there, they cannot be selected and used in a screening. Verify that all indicators were properly uploaded and are available for use in the intended category.
- Test run. Another essential step is to do a very quick screening with a random, meaningless indicator selection, just to test whether the basic functions of the Tool remain intact after your customizing. Select ‘add all watersheds’, then choose a few random indicators from each of the three indicator categories. Select RUN SCREENING, and answer YES to any prompts if they arise. You should see “Project Successfully Created” after a brief processing period. Then check the tabs below and verify that you are seeing the following types of screening results:
- RESULTS tab: lists of watersheds, index scores and rank-orders by index along with values of all indicators for all watersheds used in the screening.
- BUBBLE PLOT tab: a graph with pale blue circles of different sizes representing each watershed screened.
- HUC12 MAP tab: a simple map of the state with watershed unit boundaries superimposed; the units are initially color-coded based on the RPI index score.
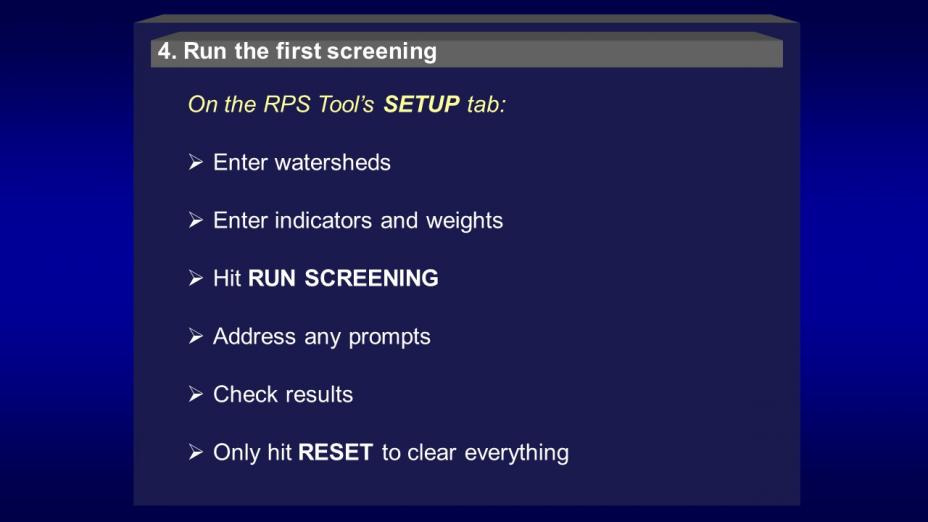
Using the Setup tab
The conditions of each screening run are all entered and processed on the SETUP tab. Here you will enter watersheds, select indicators and assign their weights. Specific training on the SETUP tab is available at RPS Training and User Support in addition to the brief summary below.
- Watershed selection. You have an option to begin any screening with all watersheds or a subset of them. On the "Select Watersheds" button, choosing “Add All Watersheds” will include every watershed unit statewide. If you would like to screen a specific subset you saved on the SUBSETS tab, then select the subset name from the drop-down menu.
- Indicators. No matter how you arrived at your indicator preferences, entering them in the RPS Tool is easily done on the SETUP tab. Click on the drop-down window for each category, and a list of indicator names will appear. Click on those you wish to use and they will fill in under each column. Double-clicking on any name brings up its description from the INDICATOR INFO tab. Although your indicator menu may have 20, 50 or more available indicators per category, you should use between 3 and 12 per category and ensure that all three categories are represented. Using too few indicators tends to make those selected potentially too influential on the RPS index scores, whereas using too many indicators can mask the influence of individually important indicators under the ‘noise’ of too many others. Further, using several indicators that are different but highly correlated can overemphasize one watershed characteristic unintentionally. Making selections from different indicator subcategories for any given screening run can help avoid over-correlated selections, but you may also wish to do a correlation analysis on a selected set of indicators to clarify where high correlations among indicators occur. One way to use correlation analysis results is to substitute highly correlated indicators for one another in different screening runs.
- Weighting. When indicators are selected on the SETUP tab, note that the cell to the right of each indicator shows a weighting factor that initially is set to 1 for all indicators. To change weights, click on the cell to the right of an indicator name and enter a new weight other than 1. Note that weighting affects indicator values only within their indicator category, not across all categories; the three categories ecological, stressor, and social are equally weighted when they are combined in the RPI score.
Running a screening
After selecting the indicators and weights on the SETUP tab, the final step is to click on RUN SCREENING. The Tool will process your screening for a brief period, usually not more than a minute. If you are screening tens of thousands of watersheds, the processing may take several minutes. During processing, the Tool may issue pop-up notes to inform you of any data characteristics that may cause you to rethink the screening parameters. These include notifying you of whether any of the indicators are equal value for all watersheds or may have blank values for some watersheds. Answering yes allows the processing to continue. The pop-up message PROJECT CREATED SUCCESSFULLY means that screening calculations are complete. You’re done!
Checking results
After your screening finishes processing, the results are automatically compiled in several different formats within your custom Tool. These include tabular, graph and mapped results. On the RESULTS tab, you will find the calculated values per watershed for the Ecological, Stressor, and Social indices as well as the Recovery Potential Integrated (RPI) score that combines all three. Each index has been calculated based on the indicators you chose. Before calculation, each indicator’s raw values are normalized to a range from 0 to 1.0 and then multiplied by the weight assigned. The indices are based on a maximum of 100. Also in the results table is the rank order of each watershed per each of the four indices.
The tabs BUBBLE PLOT and HUC12 MAP also display your screening results, although in different formats. The bubble plot is a graph format with each watershed plotted as a round symbol, located based on its unique index scores. In the plot the Ecological index is the Y (vertical) axis, the Stressor index is the X (horizontal) axis and the size of each bubble reflects the Social index score. By using the BUBBLE PLOT OPTIONS tab, users can customize a bubble plot with labels, color schemes and other changes, and then save an image of the plot. At the HUC12 MAP tab, your screening results are displayed as a simple map of the state with HUC12 boundaries superimposed. The default map after a screening run shows the RPI score values for the watersheds screened in ten color increments, but the map tab allows for customizing the map to display any index or indicator, again with the option to save the image for later use.
Automation in the RPS Tool reduces or eliminates substantial opportunities for human error in calculations, but quality control checks should still take place on the screening results in step 4. Some places to check for errors are:
- including the intended selection of indicators in the spreadsheet;
- properly assigned weights;
- whether each indicator's values are directionally consistent with its category;
- whether and how any missing data affects index values; and
- whether specific ‘good’ and ‘poor’ reference watersheds scored as expected.