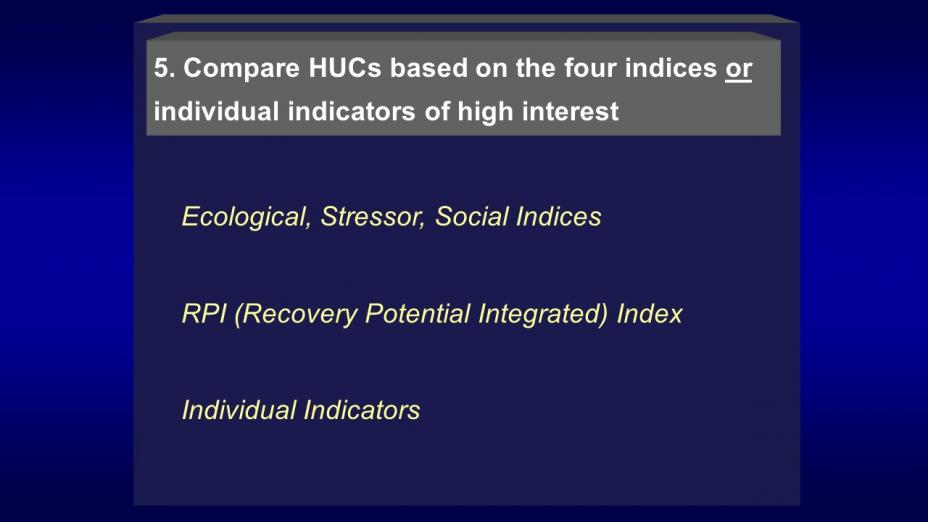
Step 5: Compare Your Watershed Units in Multiple Ways
 The first screening results from Step 4 enable you to begin comparing your watersheds in Step 5 and beyond. There is considerable flexibility in how you can use the outputs from your screening run to make these comparisons. Not only has the Tool generated four different indices, but also the three results formats (tabular rank-ordering, bubble plotting and mapping, which will be discussed in step 6) each can provide markedly different insights into how your watersheds compare. Further, exploring single indicators might reveal watershed differences closely linked with one crucial natural function or the suitability to apply a specific pollution control practice. The purpose of step 5 is to make the most of your early screening results through exploring multiple methods of comparison. Coming after the first screening run, these exploratory steps foster 'discussion support' rather than 'decision support' at a critical stage – so explore, learn and discuss, but don’t yet finalize.
On this page:
- Ecological Index
- Stressor Index
- Social Index
- Recovery Potential Integrated (RPI) Index
- Single indicator analyses
Ecological Index
The main role of the Ecological Index is to characterize a gradient of present watershed condition among the screened watersheds, either generally or with reference to specific ecological traits critical to the screening purpose. The category’s indicators are associated with aquatic and watershed natural processes such as runoff, flow, and infiltration, provision of habitat, and channel dynamics. Measures of physical structure often serve as surrogates for the natural processes they support.
An Ecological Index with a good selection of structure and process-related indicators may reasonably approximate the overall condition of each member of a subset of watersheds. One option available in every conterminous state-specific RPS Tool is to use the Preliminary Healthy Watersheds Assessments (PHWA) index and sub-index scores. The PHWA was designed and carried out in 2016 to provide a basic but reasonably comprehensive measure of watershed health across the conterminous US at the HUC12 scale. Available PHWA indicators include ecoregional and statewide versions of the Index of Watershed Health and six sub-indices (landscape condition, water quality, hydrology, geomorphic condition, habitat and biological condition). These indicators provide a frequently-used default when all that is needed from the Ecological Index is a general gradient of condition among all the watersheds being compared. Most screenings find this general characterization sufficient.
In some cases, however, it may be desirable to characterize a key attribute of condition that is especially crucial for the screening purpose. For example, with more specific user-added data, the Ecological Index can sometimes be customized to address present condition and also estimate resilience – the capacity to regain or maintain functionality in the future. In other cases, a screening may be heavily focused on one key structural attribute such as soil properties or channel form and the Index can be weighted toward those key traits moreso than general condition.
In practically all situations, the Ecological Index provides an opportunity to compare the screened watersheds purely on the basis of their condition without the important but confounding effects of the stressor and social metrics also used in the screening. Users often wish to identify some proportion of the higher-scoring watersheds (e.g., top quartile) from the Ecological Index alone, but other screening purposes may wish to identify the low-scoring members of the screened subset. Training specific to the Ecological Index is available at RPS Training and User Support.
Stressor Index
The primary use of the Stressor Index is to summarize the key traits that might degrade watershed condition and reported measures of degradation into one score. The category’s indicators are mostly potential sources of stressors, but may also include stressors themselves where measurable. Stressor indicators also include a wide array of metrics derived from state-reported impaired waters, including the pollutant causes and counts, extent of waters affected, and special metrics on several of the most commonly reported impairment types. As such, the Stressor category offers a comprehensive menu of many factors potentially associated with degrading watershed health.
Unlike the Ecological Index, a Stressor Index developed for a specific screening purpose is usually case-specific and rarely general or comprehensive across all stressors. Thus, the gradient of scores offered in Stressor Index results from a first screening should receive close scrutiny as to whether the better-known watersheds in the screening scored as expected. Among the Indices, the Stressor Index is the most likely to change indicators and/or weights as possible alternative combinations of degradation-relevant factors are explored.
Unlike the Ecological Index, the Stressor Index is frequently used to identify those watersheds in poorer condition when the screening purpose is focused on finding places to reduce severe pollutant loads. Even in such cases, it is often better to observe the Ecological and Stressor scores together to see where high opportunity for load reduction co-occurs with conditions that are still reasonably good. If the Stressor Index is used alone to compare watersheds, it is always essential to remember that the gradient of scores will reflect only those stressors selected for the screening. For example, an urban-based selection of stressor indicators would not reflect any of the potential effects from agriculture or mining. Training specific to the Stressor Index is available at RPS Training and User Support.
Social Index
The contribution of the Social Index to comparative screening can be very complex and is often data-limited. The main role played in RPS by this index is to characterize those non-environmental factors that can still highly influence efforts to restore and maintain the health of our waters. These are not ecological traits linked to condition, nor are they stressors that degrade watershed health. This is a very complex category that describes the setting within which restoration or protection efforts take place. Social context – a tapestry of community values, societal factors and institutional conditions, heavily influences watershed management efforts and their likelihood of success. Social indicator concepts abound, but nationally consistent data are limited and addition of state or local data is always welcome.
Among the attributes that comprise this index, involvement in the watershed management effort is a well-known critical factor. This can include engagement by active watershed groups, priority designation from environmental agencies, and local participation. Existing protection in the form of easements, private protection efforts and public lands, as well as regulatory efforts such as buffer ordinances, can improve the chances of successful restoration. Existing information, such as watershed plans, models, TMDLs or other reports on issues and remedies, signifies better preparedness for taking action; certainty about the causes and remedies is also crucial. Costs and complexity also are part of the social context. Where they are manageable, it can help restoration success. A broad variety of socio-economic factors include funding eligibility, goods and services helpful to local economies, and mechanisms for funding to support a management action. Some of the most powerful social factors include human health and community benefits from healthy watersheds, such as drinking water sources, recreational resources and, in some locales, the symbolic, iconic value of a natural feature that is part of the community’s identity.
Like the Stressor Index, the Social Index is usually very case-specific and the first screening’s gradient of Social Index scores is worth a close look. Where available data have captured very relevant attributes in the Index, comparing the Social scores may be particularly valuable in finding where investment of restoration effort is more likely to be supported and ultimately successful. But where limited social indicators leave gaps in these insights, the Social Index may be less reliable in the screening at hand. The ‘Neutral Social Variable’ – an indicator with equal value set at 0.5 for every watershed – is used in cases where either there are no available social indicators relevant to the screening purpose or the Social category is intentionally being held out of the screening run. Training specific to the Social Index is available at RPS Training and User Support.
Recovery Potential Integrated (RPI) Score
The RPI score combines these three indices into one. It should not be considered the only output or even the main output of RPS – it’s simply a fourth index alternative. Relying only on the RPI score misses what the ecological, stressor and social scores can tell you individually. Nevertheless, there is usually some value to summarizing how watersheds compare with “all things considered.” Despite its availability, the RPI score should never be relied upon as the only product of a screening when several, more specific and informative metrics are just as available in every set of screening results.
The RPI score has a bias that is suitable for some screenings and not for others, and that bias should be clearly understood relative to the user’s screening purpose. Because it integrates the Ecological and Social scores (in which higher score is better) with the inverse of the Stressor score (where higher is worse if not inverted), the RPI’s top scores are consistently also ‘higher is better’. In other words, watersheds in good condition with a positive social context and low stressors score well. For screenings that seek these ‘low-hanging fruit’, the RPI’s highest scores may be useful; on the other hand, projects that seek watersheds in moderately good condition paired with emerging risks from stressors should look at the Ecological and Stressor Index scores together to find where those conditions are both met.
Single indicator analyses
Comparing watersheds based on single indicators is strongly encouraged in RPS for the same reason that comparison with each individual Index is strongly encouraged – it provides an opportunity to observe more specific watershed-to-watershed differences that are often hidden in multi-metric scores. Sometimes a single indicator can be closely related to suitability for a specific restoration technique or best management practice. Below are examples of questions during screening that might be answered by viewing and comparing single-indicator values found in a typical RPS Tool:
- Where do rural residences near streams suggest an opportunity to improve septic system performance?
- Which HUC12s are headwaters and thus more likely to have restoration investments unimpacted by major upstream flows?
- Where are urban lawns near streams in highest abundance and suitable for outreach on runoff effects on waterways?
- Where does natural land cover less than 60% occur near other watersheds in which it exceeds 60%?
- Where has there been a successful track record of non-point source control projects with stakeholder cooperation?