Figures: Stressor-Response Relationships from the Field
Figure 3-6a. Stressor-Response Relationships from the Field, Supports
The impairment (dead fish) is greatest where the causal agent (the effluent) is most concentrated, and the impairment diminishes (more live fish) as the agent is diluted.
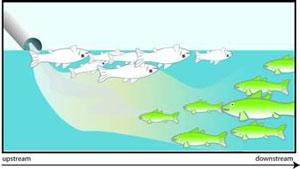 Figure 3-6a. Stressor-Response Relationships from the Field, Supports the Case
Figure 3-6b. Stressor-Response Relationships from the Field, Refutes
The impairment (dead fish) increases as the causal agent (the effluent) is diluted, and the impairment is absent where the agent is most concentrated as well as upstream.
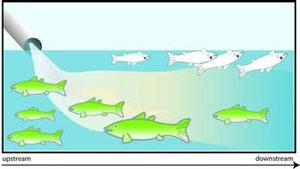 Figure 3-6b. Stressor-Response Relationships from the Field, Refutes the Case
Explanation of the Types of Evidence Illustrations
This description applies to each of the types of evidence illustrations. These illustrations provide graphic explanations of the types of evidence. They are somewhat abstract to convey that they are representative of the concept rather than illustrations of particular applications. The live fish (green and upright) represent unimpaired organisms, populations or communities of all types, not just fish. The dead fish (white and belly-up at the surface) represent all biological impairments, not just dead fish. The pipe represents all sources and the yellow effluent plume represents all causal agents (stressors), not just effluents or even chemicals. Clock faces represent the passage of time, not the particular time difference illustrated. Fish in beakers represent laboratory tests. Other graphic elements used in particular illustrations are explained in the caption.