Stressor-Response Relationships from the Field
Concept
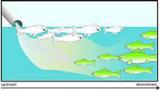
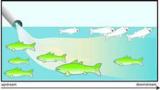
Stressor-Response Relationships from the Field: As exposure to the cause increases, intensity or frequency of the biological effect increases; as exposure to the cause decreases, intensity or frequency of the biological effect decreases.
Examples
Consider increased substrate embeddedness as a candidate cause of low mayfly (Ephemeroptera) taxonomic richness. What findings support or weaken the case for increased embeddedness as the cause, based on stressor-response relationships from the field?
- Supporting evidence - Mayfly taxonomic richness correlates inversely with % embeddeness: sites with high % embeddedness have low numbers of mayfly taxa, sites with medium % embeddedness have intermediate numbers of mayfly taxa, and sites with low % embeddedness have high numbers of mayfly taxa.
- Weakening evidence - There is no clear pattern between % embeddedness and mayfly taxonomic richness. For example, data may show that sites with both high and low % embeddedness have similar numbers of mayfly taxa.
- Weakening evidence - Mayfly taxa richness correlates directly with % embeddeness: sites with low % embeddedness have relatively few mayfly taxa, while sites with high % embeddedness have high numbers of mayfly taxa.
How Do I Analyze the Data?
Stressor-response evidence from the field is based on the classic requirement of toxicology that effects must be shown to increase with dose, but this principle also is applicable to stressors other than chemical contaminants (see above example). As with other types of evidence from the case, the most compelling evidence is based on data collected during the same time period, from a set of spatially contiguous sites in which all other candidate causes remain constant. However, the relationship may be derived from a set of sites that are located in the same vicinity, but are not spatially contiguous.
Field stressor-response relationships commonly are analyzed with correlation or regression techniques. The direction (i.e., negative or positive sign) of the correlation or regression coefficient is first evaluated to determine whether it is consistent with the causal hypothesis. For example, a positive correlation between dissolved oxygen levels and mayfly taxonomic richness would support the hypothesis that low levels of dissolved oxygen cause that impairment. Strong correlations and steep slopes increase confidence that the relationship is real. However, statistical tests of these relationships should be interpreted cautiously: these tests are very sensitive to sample size, the impaired ecosystem and treatment are not replicated, and stressor levels are not randomly assigned.
The "stressor" part of the relationship may involve measuring the candidate causal agent (the proximate stressor), or an appropriate surrogate. For example, nutrient concentrations sometimes are used as surrogates for algal growth, and stressor-response relationships showing increased impairment with increased nutrient concentrations may be used to support increased algal growth as a candidate cause. However, it is important to realize that one measure may be a surrogate for more than one stressor (e.g., nutrient concentrations also may be used as surrogates for low dissolved oxygen). Stressor-response relationships also can be based upon indicators of exposure to a stressor, such as biomarker levels or DELT (Deformities, Fin Erosions, Lesions and Tumors) counts.
Analyses of stressor-response relationships from the field are often complicated, because multiple stressors frequently co-occur. This can result in confounding: a candidate cause may show a strong relationship with the observed effect, but only because that agent is correlated with the true cause. For this reason, stressor-response relationships from the field should not be used alone to evaluate a case. Examining correlations among an entire suite of stressor variables can provide useful insights, and multivariate techniques such as principal components analysis can be used to divide stressors into groups that increase or decrease together. However, none of these techniques can eliminate the possibility that an unmeasured stressor may be the true cause of the correlation.
- Example analyses supporting stressor-response relationships from the field:
- Little Scioto River, OH
- Long Creek, ME
What Evidence Would Support or Weaken the Case for a Candidate Cause?
- Data showing that the effect decreases as the magnitude or duration of exposure to the candidate cause decreases
- Data showing that the effect increases as the magnitude or duration of exposure to the candidate cause increases
- Data showing that the effect increases as the magnitude or duration of exposure to the candidate cause decreases
- Data showing that the effect decreases as the magnitude or duration of exposure to the candidate cause increases
- Data showing that there is no change in the effect as the magnitude or duration of exposure to the candidate cause changes
How Do I Score the Evidence?
| Finding | Interpretation | Score |
|---|---|---|
| A strong effect gradient is observed relative to exposure to the candidate cause, at spatially linked sites, and the gradient is in the expected direction. | This finding strongly supports the case for the candidate cause, but is not convincing due to potential confounding. | ++ |
| A weak effect gradient is observed relative to exposure to the candidate cause, at spatially linked sites, OR a strong effect gradient is observed relative to exposure to the candidate cause, at non-spatially linked sites, and the gradient is in the expected direction. | This finding somewhat supports the case for the candidate cause, but is not strongly supportive due to potential confounding or random error. | + |
| An uncertain effect gradient is observed relative to exposure to the candidate cause. | This finding neither supports nor weakens the case for the candidate cause, because the evidence is ambiguous. | 0 |
| An inconsistent effect gradient is observed relative to exposure to the candidate cause, at spatially linked sites, OR a strong effect gradient is observed relative to exposure to the candidate cause, at non-spatially linked sites, but the gradient is not in the expected direction. | This finding somewhat weakens the case for the candidate cause, but is not strongly weakening due to potential confounding or random error. | - |
| A strong effect gradient is observed relative to exposure to the candidate cause, at spatially linked sites, but the relationship is not in the expected direction. | This finding strongly weakens the case for the candidate cause, but is not convincing due to potential confounding. | -- |
Helpful Tips
- In evaluating stressor-response relationships from the field, be sure to take into account both the magnitude and the duration of exposure to the candidate cause.
- Both the direction and magnitude of the stressor-response relationship factor into scoring of the evidence.
- Keep in mind that stressor-response relationships from the field cannot refute the case for a candidate cause, because an unexpected gradient may be due to confounding (e.g., by a strong natural gradient obscuring a gradient resulting from the candidate cause).